Paper Texture Connection Diagram – Visual Representation of Innovation
RJ0600105_11
- Last Update 07/19/2025
- File Size 7.1MB
- # of Slides 2
- File Format PPTX
- Slide Ratio 16:9
- Color
Keywords
About the Product
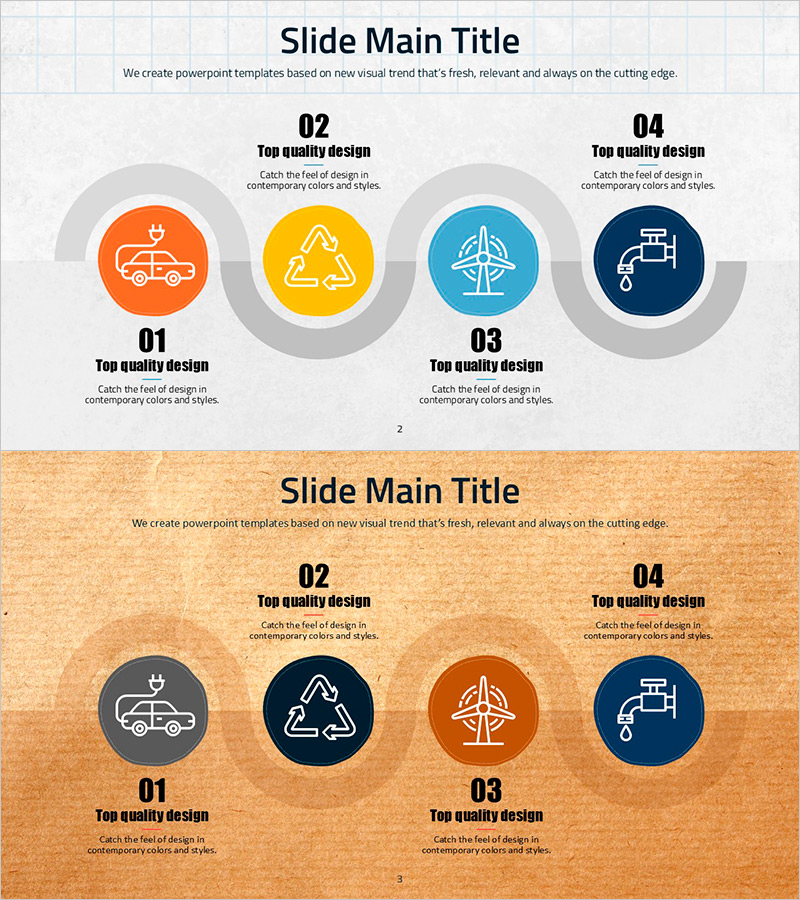
A connection diagram PowerPoint slide featuring four nodes arranged in a circular pattern on a warm paper texture background. Four colored circular icons in orange, yellow, sky blue, and navy are connected to a central gray circle, with text areas positioned below each node. This design is ideal for business presentations visualizing the interconnected relationships between four key elements, strategies, departments, or roles. The 2-slide set includes both a light gray background version and an orange paper texture version, allowing you to match your presentation's tone and visual style.
Usage Points
-
Main Usage
Visually represents the interconnected relationships between four key elements, strategies, departments, or roles. The radial connection structure from a central hub to four nodes emphasizes equal importance and mutual interdependence among items.
-
How to Use
Enter department names, strategy titles, roles, or functions in the text areas below each colored icon. Colors and icons are fully editable, allowing customization to match your presentation topic. Choose between the light background and orange paper texture version based on your slide sequence.
-
Recommended For
Executives, planners, and marketing teams explaining organizational structure, business strategies, marketing channels, or product features. Suitable for company overview presentations, business plans, strategy pitches, and organizational restructuring announcements.
-
Slide Structure
2-slide set. Each slide contains one central gray circle and four colored circular nodes (orange, yellow, sky blue, navy) connected by lines. Four text input areas are positioned below the nodes for labeling.
Related Products
-

Award-winning Performance Related to Facility System – Presentation of Innovative Achievements
#Company Introduction #Diagram #Other
-

Introducing Stable Service Characteristics – Cluster Diagram
#Product/Service Introduction #Diagram #Product/Service Introduction
-

Urban-Based Business Timeline Flow – Capturing Visual Changes
#Company Introduction #Business Management #Diagram
-

Triangle Pattern Wide Table PPT Template – Ideal for Company and Service Introduction
#Company Introduction #Product/Service Introduction #Diagram
