Cluster Diagram Slide Visualizing a Scientific and Technological System
RJ0500048_26
- Last Update 06/20/2025
- File Size 0.4MB
- # of Slides 2
- File Format PPTX
- Slide Ratio 16:9
- Color
Keywords
- #Content-Based Slides
- #Design-Based Slides
- #Operational Plan
- #Technical Approach
- #Diagram
- #Production and Technology Development Strategy
- #Innovative Technologies and Future Plans
- #Cluster
- #Chain Diagram
- #16:9
- #cluster diagram PowerPoint
- #radial node diagram slide
- #scientific system visualization
- #organizational structure PPT
- #technology framework diagram
- #hub-and-spoke PowerPoint template
About the Product
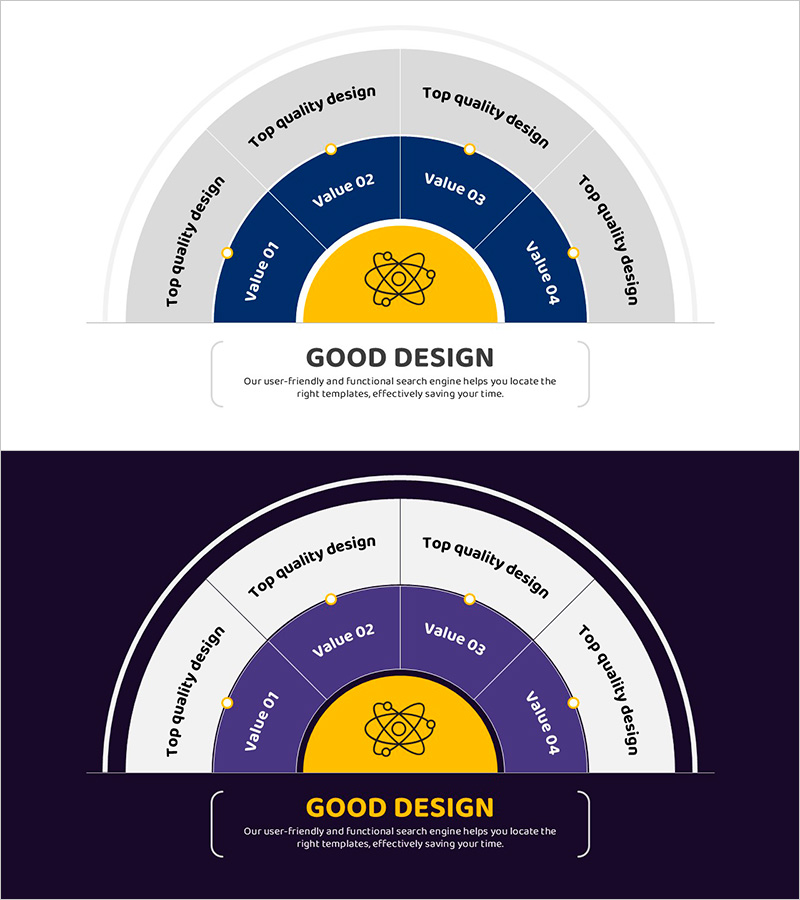
A cluster diagram PowerPoint slide featuring a central circular icon connected to four radial nodes, ideal for visualizing scientific and technological systems. The design combines a light gray background with deep blue sectors and a golden center, making it perfect for presenting organizational hierarchies, process connections, and technical frameworks. Two slide layouts are included: one with a light background and one with a dark background for flexible presentation contexts. Each node provides dedicated text input areas for customization. The 16:9 widescreen PPTX format allows immediate editing and seamless integration into your presentation.
Usage Points
-
Main Usage
Effectively communicate interconnected relationships within complex systems such as scientific frameworks, organizational structures, operational hierarchies, and technical domains. The hub-and-spoke layout simplifies multi-layered information into a visually coherent diagram that enhances audience comprehension.
-
How to Use
Enter your core concept (e.g., Scientific Technology, Operations Strategy) in the central golden hub. Populate the four radial nodes with supporting elements (e.g., Research Division, Operations Planning, Resource Management, Performance Evaluation). Adjust text size and node colors to emphasize priority and hierarchy.
-
Recommended For
Technology companies presenting R&D strategies, research institutions explaining scientific frameworks, IT organizations introducing system architecture, government agencies outlining policy structures, and universities showcasing departmental organization and research domains.
-
Slide Structure
Central golden circular hub with icon + four deep blue radial sectors + gray outer border frame. Each node functions as an independent text input area. Two complete layouts provided: light background and dark background versions for versatile presentation scenarios.
Related Products
-

Efficient Network Connectivity Diagram – Innovative Technology and Future Planning
#Operational Plan #Technical Approach #Diagram
-

Work Plan for Future Technologies – Innovation and Connectivity
#Operational Plan #Technical Approach #Diagram
-

Illustration Map and Tree Analysis Slide – Operational Planning and Innovative Technology
#Operational Plan #Technical Approach #Diagram
-

Infographic Slide Visualizing Core Cosmetics Components
#Business Strategy #Operational Plan #Diagram
