Green Check Table – Visual Insights
RJ0600097_11
- Last Update 07/17/2025
- File Size 1.9MB
- # of Slides 2
- File Format PPTX
- Slide Ratio 16:9
- Color
Keywords
About the Product
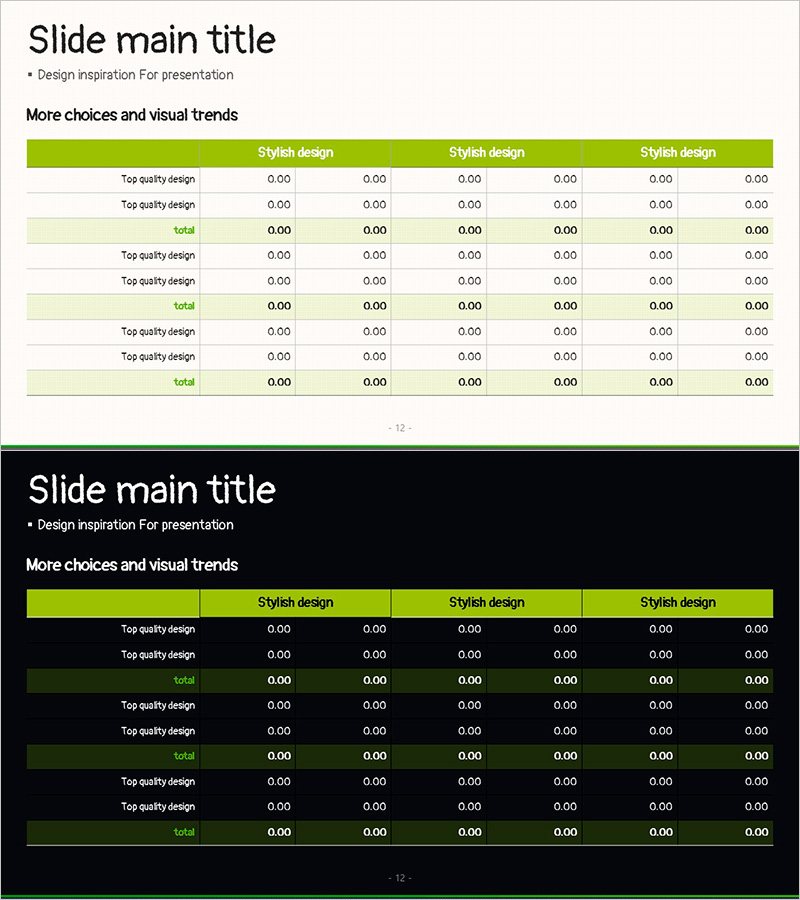
A table diagram PowerPoint slide featuring a 6-column, 9-row structure with lime green header and alternating white and light green row backgrounds for optimal data readability. Each cell is fully editable for numerical input, qualitative ratings, and comparative analysis. Ideal for performance tracking, competitive benchmarking, budget allocation, survey results, and multi-criteria evaluation. Two-slide set includes both light background and dark background versions, allowing you to match your presentation environment and document style seamlessly.
Usage Points
-
Main Usage
This table diagram is optimized for side-by-side comparison of quantitative data and qualitative assessments. Perfect for departmental performance reviews, product specification comparisons, competitive analysis, survey result aggregation, budget allocation by category, and any data-driven decision-making presentation.
-
How to Use
Enter category names in the header row and item names in the left column, then populate each cell with numerical values or evaluation symbols. The lime green header draws attention to key information, while row color differentiation makes data tracking effortless. Use the light background version for printing and PDF distribution; use the dark background version for on-screen presentations.
-
Recommended For
Finance and planning teams presenting budget analysis, marketing teams comparing channel performance, sales teams evaluating client profiles, HR teams conducting competency assessments, operations teams managing process checklists, and any department requiring structured quantitative data presentation.
-
Slide Structure
Two-slide set with identical 6-column by 9-row table layout. First slide features white and light green alternating row backgrounds; second slide uses a dark background with the same table structure. All cells are fully editable with customizable colors, fonts, and cell borders. Header row spans all six columns with green fill for visual emphasis.
Related Products
-

Horizontal Bar Chart for Professional Team Human Resources Analysis
#Company Introduction #Market and Competitor Analysis #Diagram
-

Blue Pink Business Goals Connection Diagram
#Business Vision and Strategy #Business Strategy #Diagram
-

Analysis of Causes for Increase/Decrease in a Multidirectional Flow - Business Strategy
#Business Strategy #Operational Plan #Diagram
-

Business Overview Square Diagram – Clear Business Introduction
#Company Introduction #Business Introduction #Diagram
