A Perfect Eating Diagram – Overview of Food Service
RJ0600095_22
- Last Update 07/16/2025
- File Size 0.6MB
- # of Slides 2
- File Format PPTX
- Slide Ratio 16:9
- Color
Keywords
- #Content-Based Slides
- #Design-Based Slides
- #Product/Service Introduction
- #Technical Approach
- #Diagram
- #Product/Service Introduction
- #Service Components
- #Spread
- #16:9
- #service overview diagram PowerPoint slide
- #radial expansion diagram
- #product introduction slide
- #service structure PPT
- #how to create a service diagram in PowerPoint
About the Product
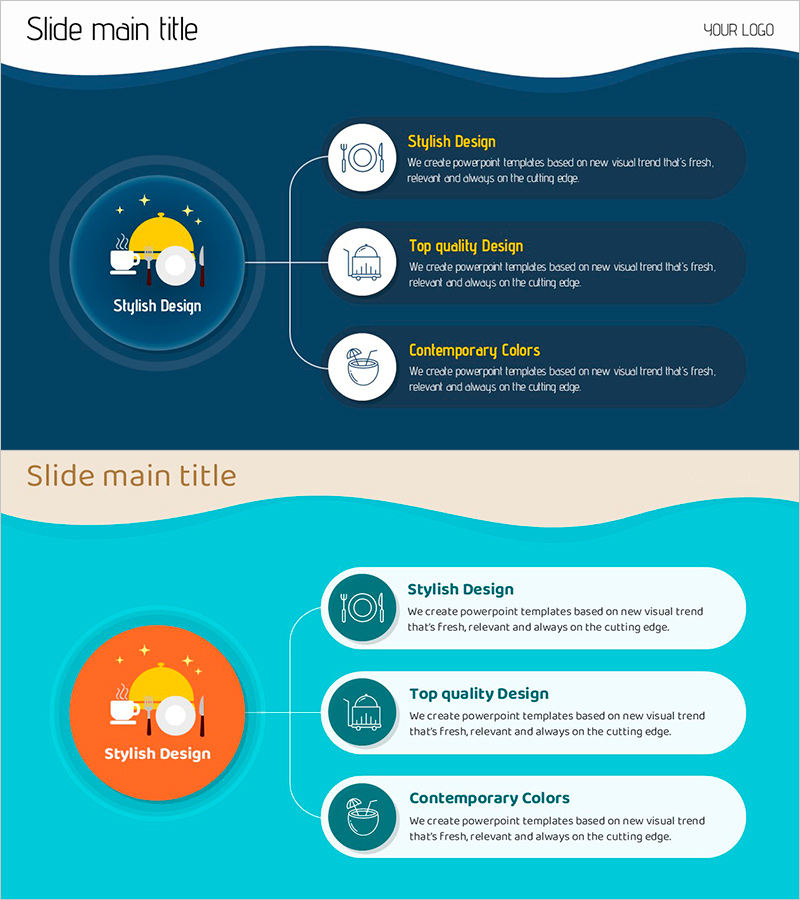
A radial expansion diagram PowerPoint slide designed for product and service introduction presentations. The layout features a central circular icon that branches into three key items, expressing core services and detailed features in a hierarchical structure. The dark blue background combined with white circular buttons and gold text conveys professionalism and trustworthiness. Each item includes an icon and text input area, making it immediately applicable to company profiles, product brochures, service proposals, and other business documents. The 16:9 widescreen format with 2-slide composition ensures easy editing and flexibility.
Usage Points
-
Main Usage
This slide effectively presents a product or service's core features by expanding from a central element into three key items in a hierarchical manner. Ideal for explaining service structure, core values, or main functions, it enables clear communication of service architecture to investors and partners.
-
How to Use
Enter your core service name or brand in the central circular area, then input detailed items (features, functions, benefits) in the three right-side circular buttons. Customize the icons and descriptive text for each item to match your specific service offering.
-
Recommended For
Recommended for product brochures, service proposals, company profile service sections, investor presentations, and partnership proposals. Particularly suited for B2B presentations where clear distinction between core services and detailed features is essential.
-
Slide Structure
2-slide composition featuring a dark blue background version and a turquoise background version. Each slide contains 4 input areas: 1 central circle + 3 right-side circles, with icons and text boxes positioned in each circular element for easy customization.
Related Products
-

Library Services Slide
#Product/Service Introduction #Technical Approach #Diagram
-

Diagram Slide Visualizing Recipe Key Ingredients
#Product/Service Introduction #Diagram #Product/Service Introduction
-

Product Feature and Ingredient Overview Content Slide
#Product/Service Introduction #Diagram #Product/Service Introduction
-

Modern Presentation Design – Capturing Professionalism and Emotion
#Product/Service Introduction #Diagram #Product/Service Introduction
