Travel Program Composition Ratio Slide – Effective Information Delivery
RJ0600095_11
- Last Update 07/16/2025
- File Size 0.7MB
- # of Slides 2
- File Format PPTX
- Slide Ratio 16:9
- Color
Keywords
- #Content-Based Slides
- #Design-Based Slides
- #Product/Service Introduction
- #Business Strategy
- #Diagram
- #Program Introduction
- #Cluster
- #Closed Cluster Diagram
- #16:9
- #circular ratio diagram PowerPoint
- #4-section composition slide
- #travel program presentation template
- #percentage visualization slide
- #closed-form diagram PowerPoint
About the Product
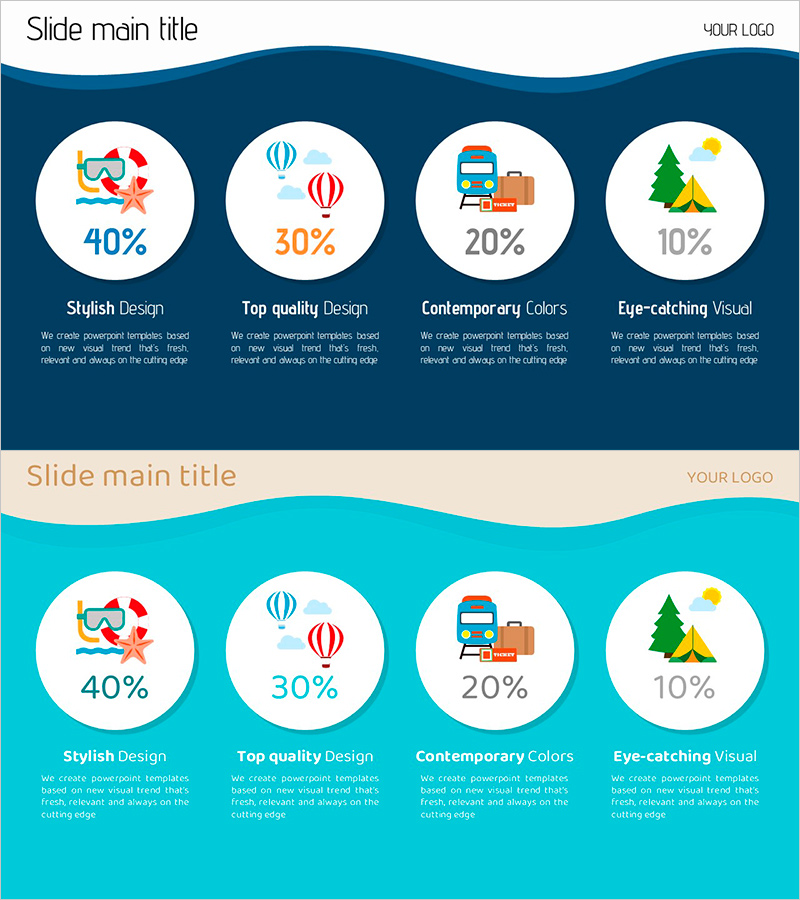
A PowerPoint slide template that visualizes travel program composition ratios using four circular nodes with percentage values and icons. The dark blue background with white circular frames creates strong visual contrast, making each program component's proportion immediately clear. Ideal for travel agencies, tourism marketing, and event planning presentations. Includes 2 slide variations in dark blue and turquoise color schemes, with fully editable text and percentage fields for customization.
Usage Points
-
Main Usage
Visualize travel itinerary components—accommodation, meals, activities, and transportation—as percentage breakdowns to clearly communicate program structure to clients. Each circular node functions as an independent information area, making it effective for travel proposals, tourism marketing materials, and event planning presentations.
-
How to Use
Replace percentage values and text labels with your travel program elements (lodging, dining, activities, transfers). Swap icons to match program characteristics and adjust colors according to brand guidelines. Use both slide variations for comparison or select a single version for your presentation.
-
Recommended For
Travel agencies, tourism boards, event planners, hotels, and resort marketing teams presenting program details to clients. Also suitable for educational institutions explaining field trips and school excursions, or corporate teams introducing workshop and team-building schedules.
-
Slide Structure
2-slide set with 4 equally-sized circular nodes arranged horizontally on each slide. Each node displays a percentage value at center, an icon above, and a label below. Backgrounds alternate between dark blue (slide 1) and turquoise (slide 2), with a wave-shaped top border for visual cohesion.
Related Products
-

PowerPoint Slide for Idea Strategy Leading to Victory
#Product/Service Introduction #Business Strategy #Diagram
-

How to Take Care of Cats Visualized in a PowerPoint Template – Love and Care
#Product/Service Introduction #Business Strategy #Diagram
-

Space Industry Schedule Diagram – Introduction to Business Development Strategy
#Product/Service Introduction #Business Strategy #Diagram
-

Preparation for a Delicious Dish – Visual Diagram Utilization
#Product/Service Introduction #Business Strategy #Diagram
