Infographic Slide Maximizing Visual Data Representation
RJ0600093_28
- Last Update 07/16/2025
- File Size 1MB
- # of Slides 2
- File Format PPTX
- Slide Ratio 16:9
- Color
Keywords
- #Content-Based Slides
- #Design-Based Slides
- #Business Strategy
- #Business Management
- #Diagram
- #Marketing Plan
- #Implementation Plan
- #Cluster
- #Closed Cluster Diagram
- #16:9
- #infographic PowerPoint slide
- #data comparison template
- #3-item diagram
- #numerical data visualization
- #business infographic slide design
About the Product
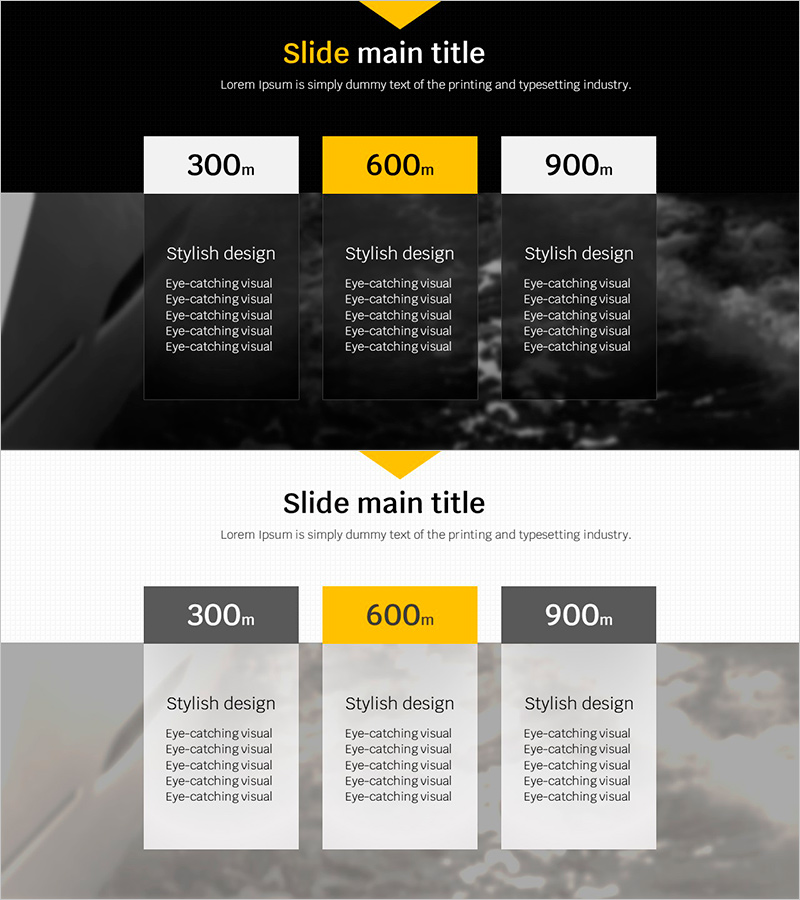
A 3-item comparison infographic PowerPoint slide that maximizes data visualization and numerical representation. The design features a black background with yellow accent boxes and white text areas, clearly distinguishing each item's metrics (300m·600m·900m). This 2-slide presentation template is ready for immediate use in various business scenarios, offering flexible layouts for adding descriptive text to each section. Optimized for business presentations, marketing proposals, and product introduction slides where data visualization is essential.
Usage Points
-
Main Usage
An infographic slide designed for numerical comparison and data visualization. The 3-item layout with side-by-side arrangement enables intuitive comparative analysis, with yellow accent boxes highlighting key metrics. Ideal for presenting quantitative information such as marketing performance, product specifications, and market size.
-
How to Use
Enter your title in the top section against the black background, then input item names and numerical values in the three box areas. Add descriptions or features for each item in the lower text sections to complete the slide. The 16:9 aspect ratio is optimized for widescreen presentations, and all colors and text are fully editable.
-
Recommended For
Recommended for marketing team performance reports, sales presentations, product comparison analysis, market research presentations, and financial report sections requiring numerical comparisons. Particularly useful for executive briefings, investor pitches, and client proposals where 3-item quantitative comparison is needed.
-
Slide Structure
2-slide composition with each slide featuring a black background, title area at the top, and three independent boxes in the center (white metric box + yellow accent box + white text area). Structured with 3 nodes, each containing 3 input areas (metric, title, description).
Related Products
-

Setting up a Business Plan – Strategic Approach
#Business Strategy #Business Management #Diagram
-

AS-IT TO-BE Detailed Planning Table – Business Strategy
#Business Strategy #Business Management #Diagram
-

Diagram Slide for How to Grow Carrots
#Business Strategy #Business Management #Diagram
-

Blue Step-by-Stage Vacation Plan
#Business Strategy #Business Management #Diagram
