Diagram Slide to Show Natural Environmental Composition
RJ0600091_16
- Last Update 07/15/2025
- File Size 3.5MB
- # of Slides 2
- File Format PPTX
- Slide Ratio 16:9
- Color
Keywords
- #Content-Based Slides
- #Design-Based Slides
- #Product/Service Introduction
- #Corporate Social Responsibility
- #Diagram
- #Product and Service Overview
- #Environmental Protection Efforts
- #Cluster
- #Closed Cluster Diagram
- #16:9
- #natural environment diagram PowerPoint
- #cluster diagram slide template
- #environmental composition chart
- #overlapping diagram
- #sustainability presentation
- #CSR PowerPoint slide
- #how to create environment diagram in PowerPoint
About the Product
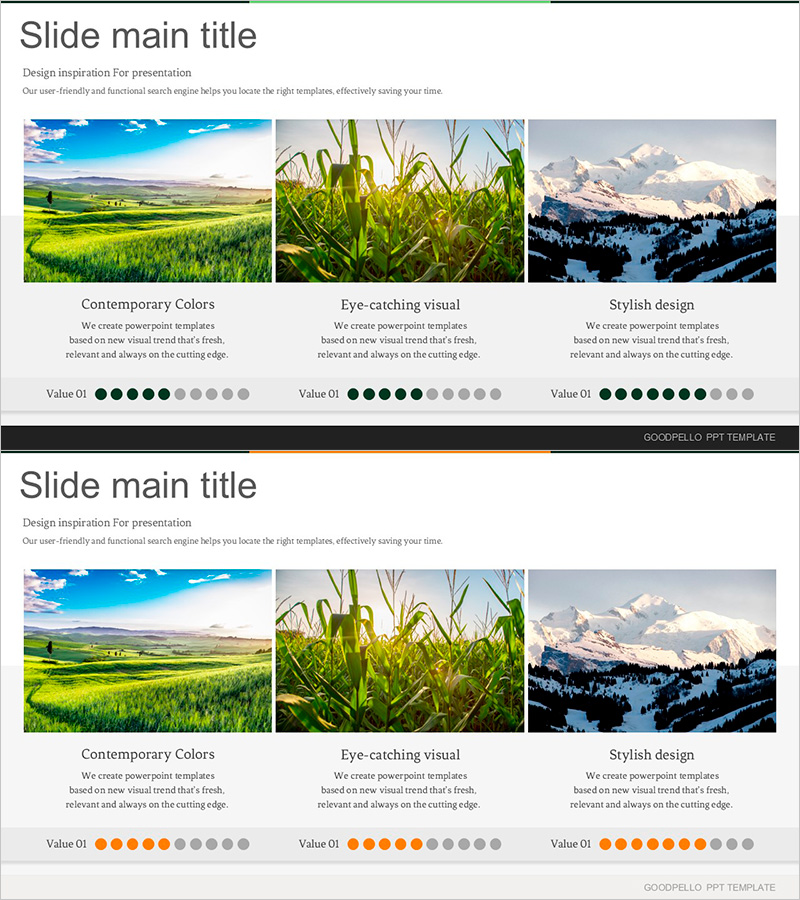
A cluster diagram PowerPoint slide that visualizes natural environmental composition across three overlapping zones. This radial structure expands from a central concept to surrounding elements, making it ideal for environmental protection, corporate social responsibility, and product introduction presentations. The design uses black, orange, and gray dot indicators to quantify the value of each zone, optimized for 16:9 widescreen format in a 2-slide set. Fully editable PPTX format allows you to customize text and images for any presentation context.
Usage Points
-
Main Usage
Designed to present multi-layered environmental composition elements at a glance using an overlapping cluster structure. The radial flow from central concept to surrounding details effectively communicates the interconnectedness of environmental systems. Dot indicators quantify the importance of each zone, supporting comparative analysis and data-driven storytelling.
-
How to Use
Use in corporate environmental presentations, ESG reports, sustainability project explanations, and environmental education seminars. Replace text and images in each zone to highlight specific environmental elements such as forests, water resources, and atmosphere. Modify dot colors to represent priority levels or change indicator values to reflect different data sets.
-
Recommended For
Recommended for environmental managers, ESG planning teams, sustainability specialists, environmental educators, product development teams (eco-friendly products), and corporate social responsibility departments. Suitable for corporate presentations, academic seminars, government reports, and NGO activity explanations.
-
Slide Structure
2-slide set, each featuring a 3-zone overlapping cluster diagram. The structure radiates from a central circular node to three zones (left, center, right), with black, orange, and gray dot indicators (8–10 dots per zone) below each area representing value scales. Optimized for 16:9 widescreen format with ample text input areas and image insertion spaces for customization.
Related Products
-

Dot Patterns Wide PowerPoint Template – Square Diagram for Product and Service Presentation
#Product/Service Introduction #Diagram #Text Box
-

Trial Closure Diagram for Legal Process Explanation
#Product/Service Introduction #Diagram #Features
-

Eco-Energy Strategies on the Global Stage
#Business Vision and Strategy #Corporate Social Responsibility #Diagram
-

Social Responsibility Diffusion Diagram – A New Vision for Environmental Protection
#Corporate Social Responsibility #Diagram #Environmental Protection Efforts
