Future Market Analysis Graph – Trends at a Glance
RL0100034_3
- Last Update 10/20/2025
- File Size 3.6MB
- # of Slides 2
- File Format PPTX
- Slide Ratio 4:3
- Color
Keywords
About the Product
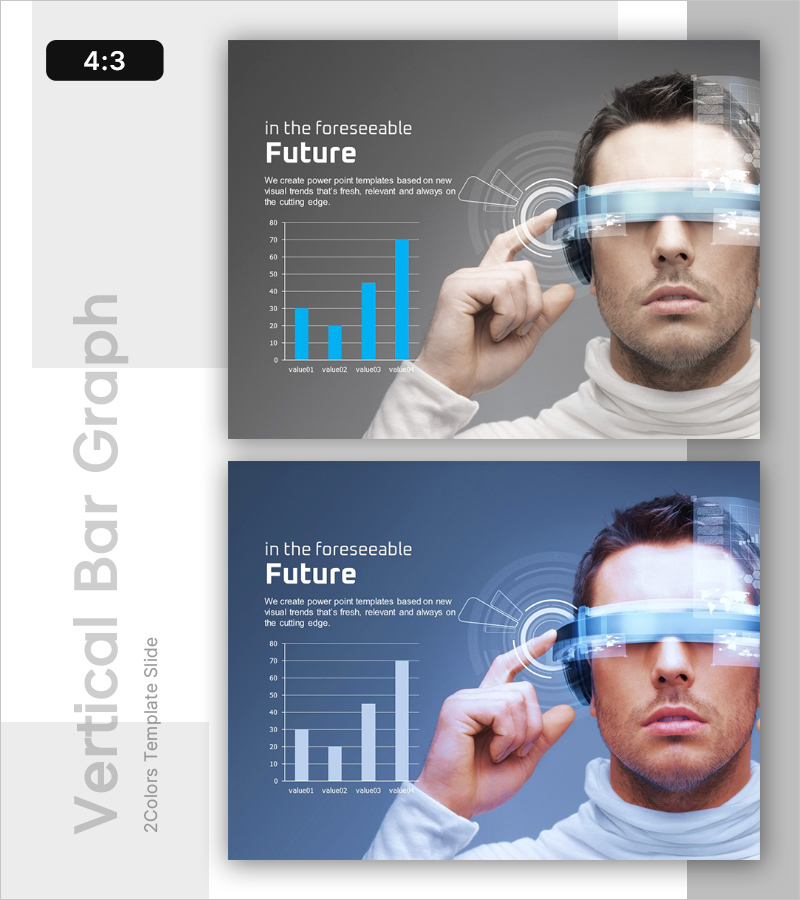
A 2-slide PowerPoint presentation designed to visualize future market trends and growth projections. Features a vertical bar chart with four data points displayed in blue against a gray background, paired with a large forward-looking human image and technology icons on the right. The left side provides space for title and descriptive text, creating a professional, future-oriented aesthetic. Formatted in 4:3 ratio PPTX, ready to integrate into existing presentations. Ideal for market analysis, business strategy discussions, investor pitches, and competitive positioning reports.
Usage Points
-
Main Usage
Designed to communicate future market opportunities and growth trajectories through clear data visualization. The vertical bar chart compares four data points—such as market size, growth rate, or projected values—enabling stakeholders to quickly grasp market dynamics and investment potential.
-
How to Use
Insert into business plans, investor presentations (IR decks), or market analysis reports in the market overview or opportunity sections. Replace the chart data with actual figures, update the left-side text with your title and description, and customize the icons and imagery to match your brand identity.
-
Recommended For
Executives, business development teams, marketing professionals, investment managers, and consultants presenting market expansion, new business ventures, or funding opportunities. Particularly effective when emphasizing future growth potential and market-driven decision-making.
-
Slide Structure
Two-slide layout with each slide divided into left text area (one-line title, three to four descriptive lines) and right visual area (four-item vertical bar chart in blue, technology icons, and human imagery). Optimized for 4:3 aspect ratio with gray background and blue accent colors for data emphasis.
Related Products
-

Corporate Future Outlook Analysis Graph – Visualizing Future Predictions
#Emotional Messages
-

Future-oriented Template Cover – Bright Vision Ahead
#Emotional Messages
-

Innovative Idea Template Ending Cover
#Emotional Messages
-

Radical Social Advancement – Innovation through Visual Appeal
#Emotional Messages
