Donut Connection Diagram – Modern Design and Communication
RJ0600085_10
- Last Update 07/13/2025
- File Size 0.7MB
- # of Slides 2
- File Format PPTX
- Slide Ratio 16:9
- Color
Keywords
About the Product
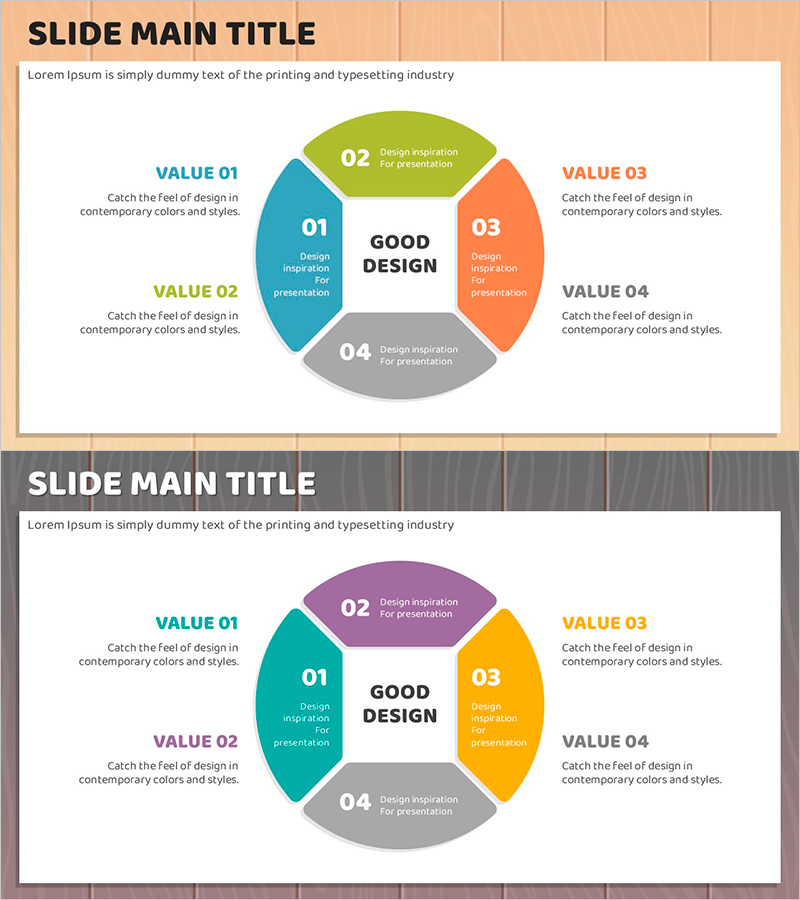
A PowerPoint diagram slide featuring four items arranged in a donut-shaped connection pattern around a central message. The design uses four distinct colors—teal, lime green, orange, and gray—positioned radially, with each section containing a number and descriptive text. VALUE 01-04 labels are placed on the left and right sides to clarify the information structure. This presentation slide effectively visualizes core values, strategic pillars, four-step processes, organizational roles, or product characteristics. The template includes 2 slides with color variations, optimized for 16:9 widescreen format and fully editable in PowerPoint.
Usage Points
-
Main Usage
Designed to visualize organizational core values, strategic pillars, four-step processes, or key concepts with a central message at the hub. The donut-shaped connection structure intuitively expresses relationships and interactions between items, making it ideal for business presentations, strategy sessions, product introductions, and organizational culture explanations.
-
How to Use
Edit the central text area with your core message, then modify the four donut sections' numbers and descriptions. Each color segment is independently editable, allowing you to adjust item count or change colors as needed. The VALUE labels on both sides can also be freely customized to match your content.
-
Recommended For
Recommended for executives, marketing teams, strategic planning departments, and product development teams presenting core values, competitive advantages, business domains, or organizational roles. Particularly effective when four elements need equal emphasis or when a central message requires surrounding supporting points.
-
Slide Structure
Central text area with four donut sections arranged radially at top, right, bottom, and left positions. Each section includes a number (01-04) and descriptive text. VALUE 01-04 labels are positioned on the left and right sides. Two slide variations with different color schemes are included.
Related Products
-

Stylish PowerPoint for Visualizing Business Processes
#Business Strategy #Diagram #Implementation Framework
-

Introduction to Major Crops – Effectively Presenting Product/Service Benefits with Cluster Diagram
#Product/Service Introduction #Diagram #Product/Service Introduction
-

Progress of the European Space Industry by Region Diagram
#Market and Competitor Analysis #Marketing Plan and Strategy #Diagram
-

Table Chart and Descriptive Text – Visualizing Sales Metrics
#Financial Plans and Performance #Diagram #Sales and Revenue
