Climbing Template Propulsion Process – Marketing Strategy and Goals
RJ0600082_8
- Last Update 07/12/2025
- File Size 4.5MB
- # of Slides 2
- File Format PPTX
- Slide Ratio 16:9
- Color
Keywords
- #Content-Based Slides
- #Design-Based Slides
- #Marketing Plan and Strategy
- #Diagram
- #Marketing Objectives
- #Marketing Strategy
- #Cluster
- #Chain Diagram
- #16:9
- #timeline diagram PowerPoint
- #connection diagram slide
- #marketing propulsion process
- #3-step process diagram PowerPoint
- #business timeline slide template
- #how to create timeline diagram in PowerPoint
About the Product
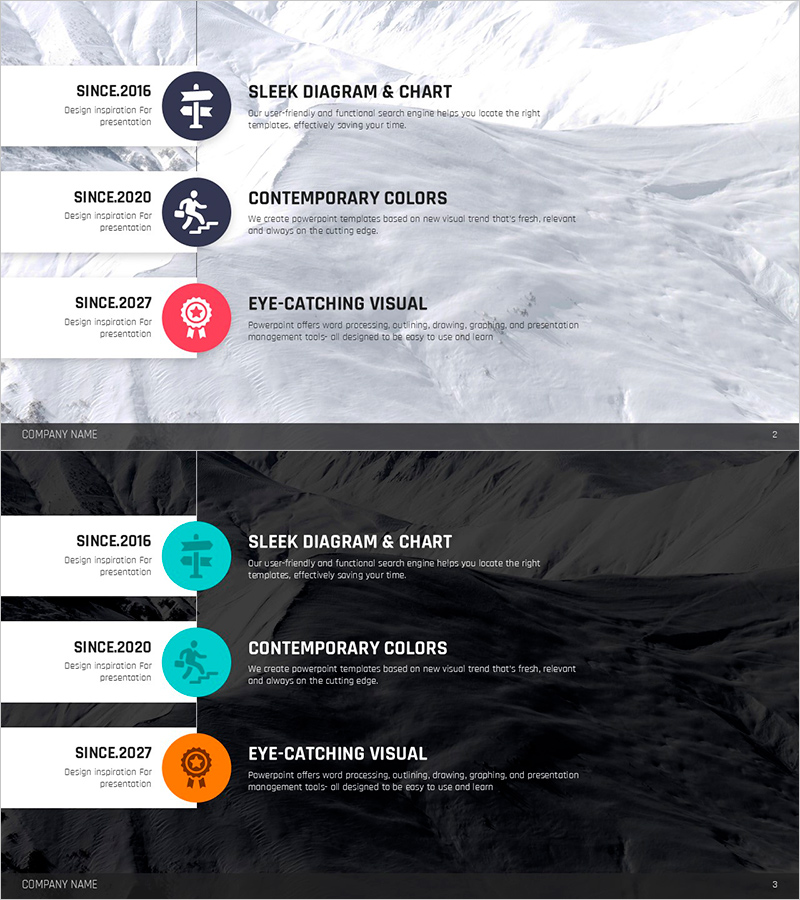
A vertical timeline connection diagram PowerPoint slide that visualizes the step-by-step marketing strategy propulsion process from planning through execution to results. Three nodes (2016 Planning, 2020 Execution, 2027 Results) are positioned symmetrically on both sides of a central vertical line, each marked with circular icons and connected text labels. The slide set includes both light and dark background versions for flexible presentation themes. All node elements are fully editable and ready for immediate use in business presentations.
Usage Points
-
Main Usage
Visualizes the three-phase marketing strategy propulsion process—planning, execution, and results—along a chronological timeline. Ideal for executive reports, marketing strategy presentations, and business plan pitches where you need to communicate strategic progression and milestone achievement clearly.
-
How to Use
Edit the text labels and icons in each node to match your project phases and timeline. Apply the light background version for bright-themed presentations and the dark background version for dark-themed decks. Customize node colors (dark blue, cyan, red) to represent phase priority or status as needed.
-
Recommended For
Marketing managers, strategy planning teams, and business development professionals presenting project timelines and strategic goals. Suitable for startup growth stage explanations, corporate mid-term strategy presentations, and consulting firm project roadmap demonstrations.
-
Slide Structure
Vertically centered timeline with three symmetrically positioned nodes on both sides. Each node consists of a circular icon (cross symbol, running figure, award badge) paired with text labels (SINCE year + title). Nodes are connected by a central vertical line. Two-slide set provides both light and dark background versions.
Related Products
-

Strategic Planning Through the Pyramid of Goals
#Marketing Plan and Strategy #Diagram #Marketing Objectives
-

Pricing Strategy 4 Step Diagram – Visualizing Marketing Strategy
#Marketing Plan and Strategy #Diagram #Pricing Strategy
-

Marketing Mix 4P Linear Diagram
#Business Vision and Strategy #Marketing Plan and Strategy #Diagram
-

Business Goal Linkage Diagram – Strategic Connection and Collaboration
#Business Vision and Strategy #Marketing Plan and Strategy #Diagram
