Retirement PowerPoint Template – Warm and Emotional Design
B0700029
- Last Update 01/02/2025
- File Size 6.2MB
- # of Slides 20
- File Format PPTX
- Slide Ratio 4:3
- Color
Slide Preview


Keywords
About the Product
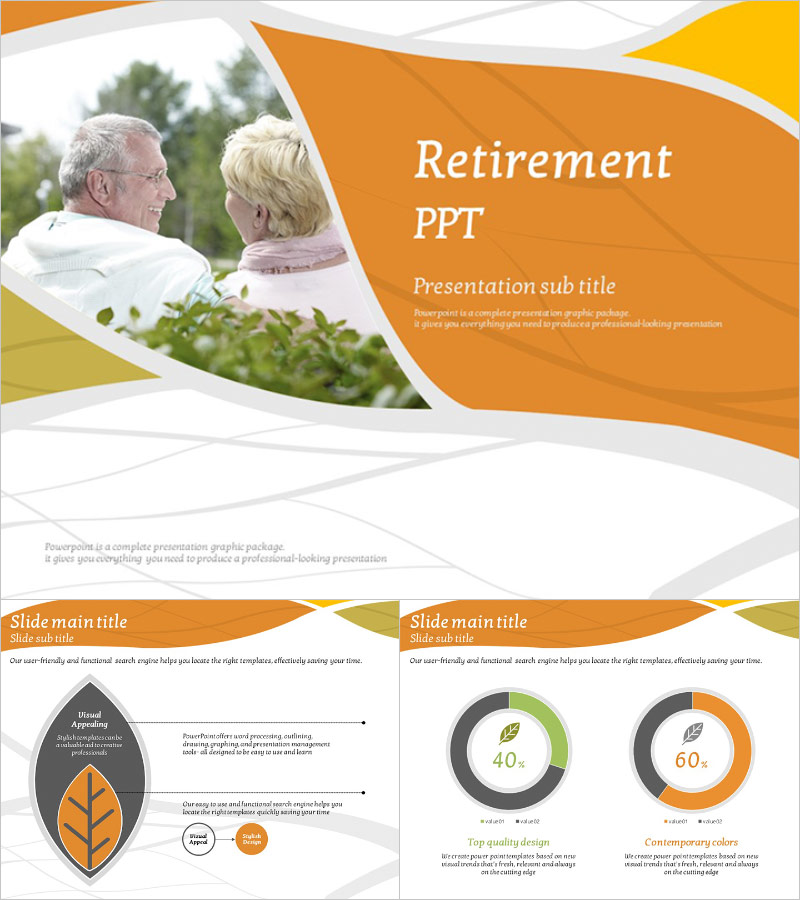
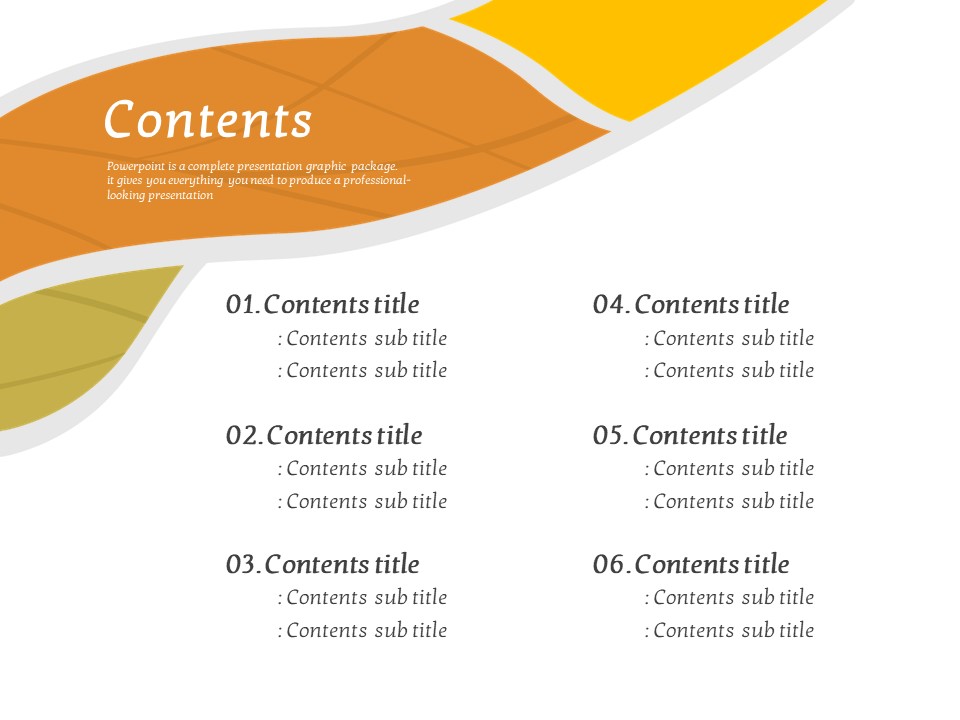
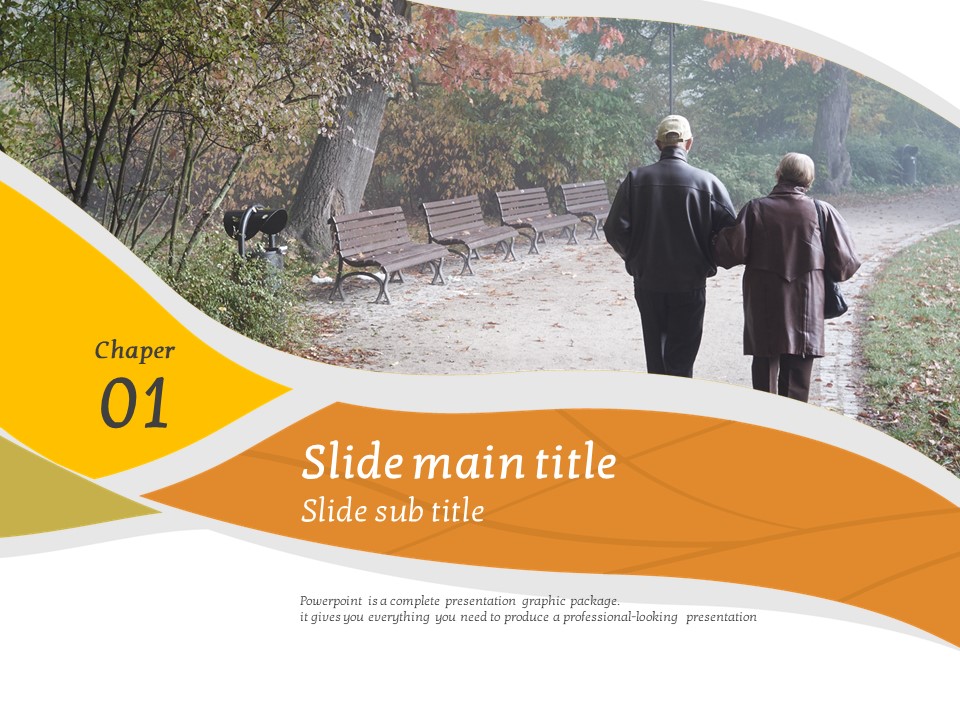
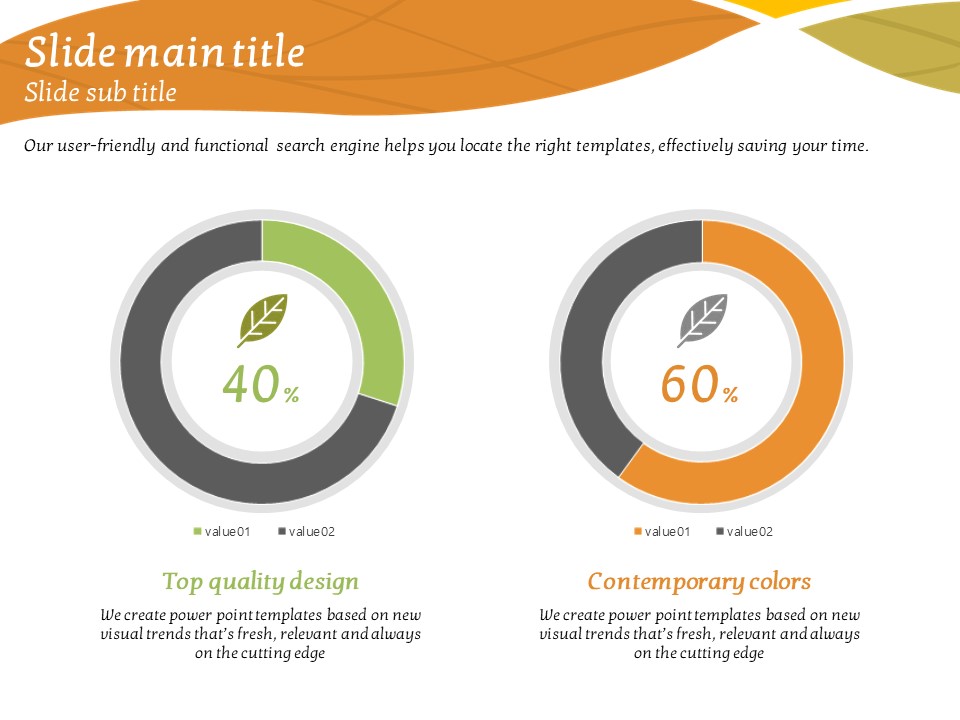
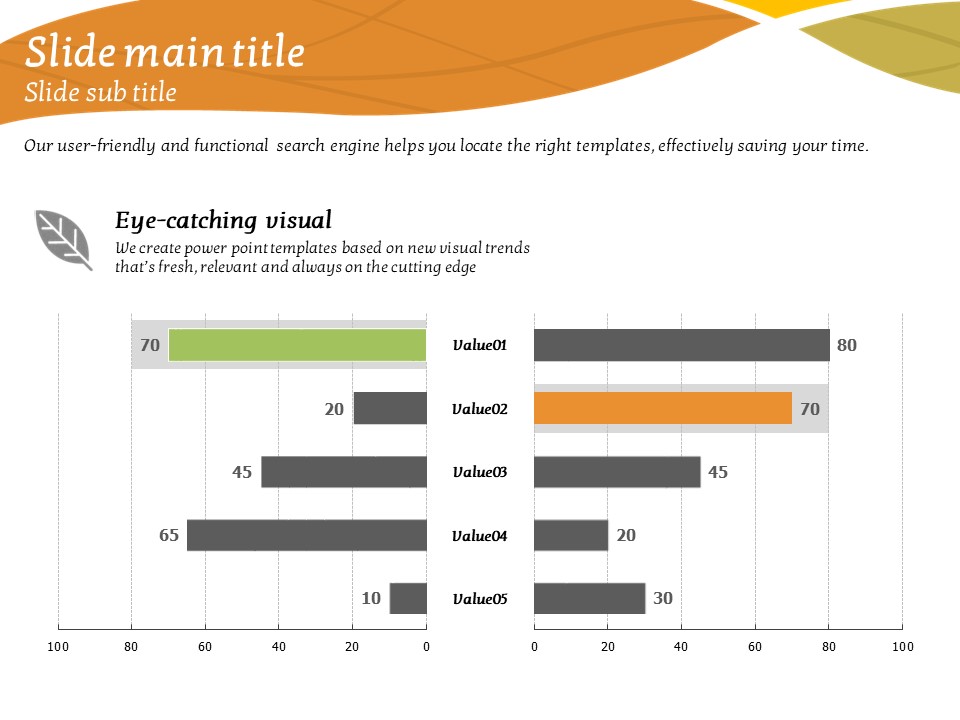
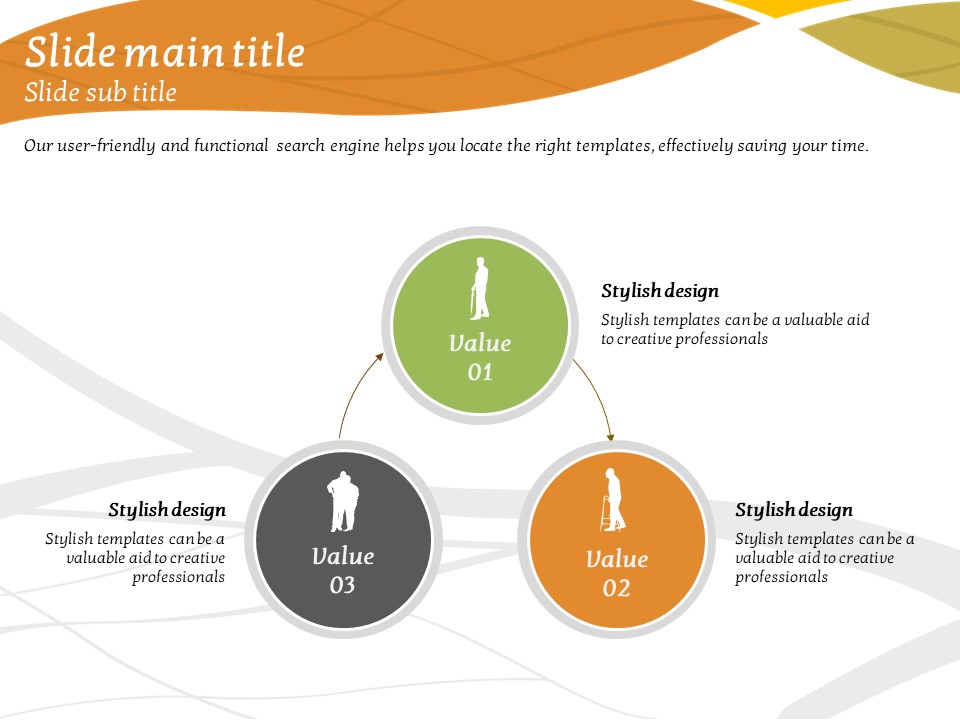
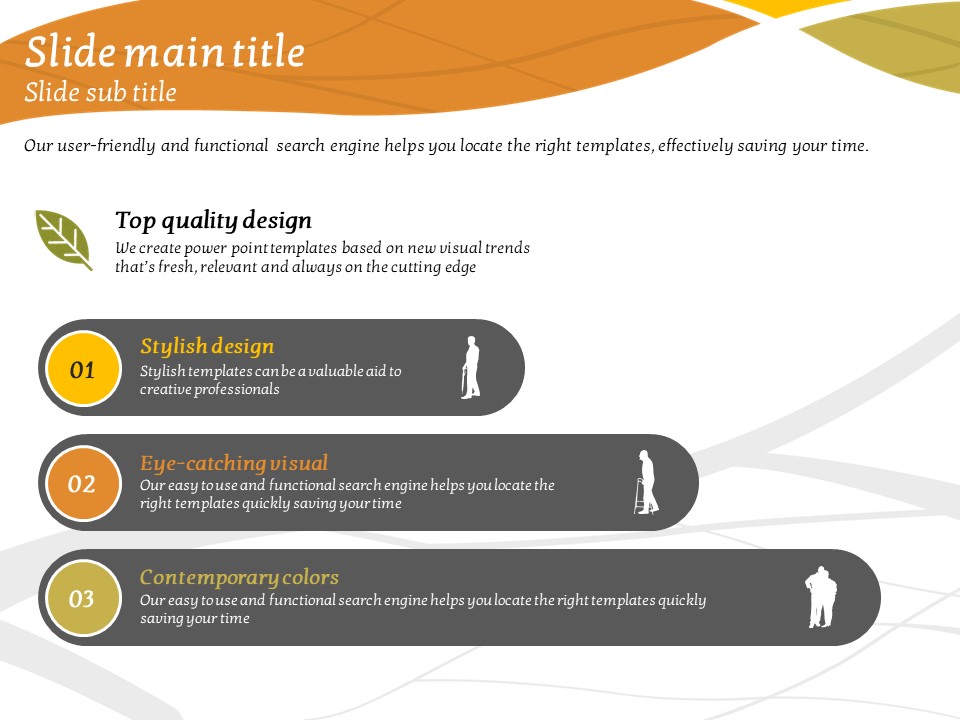
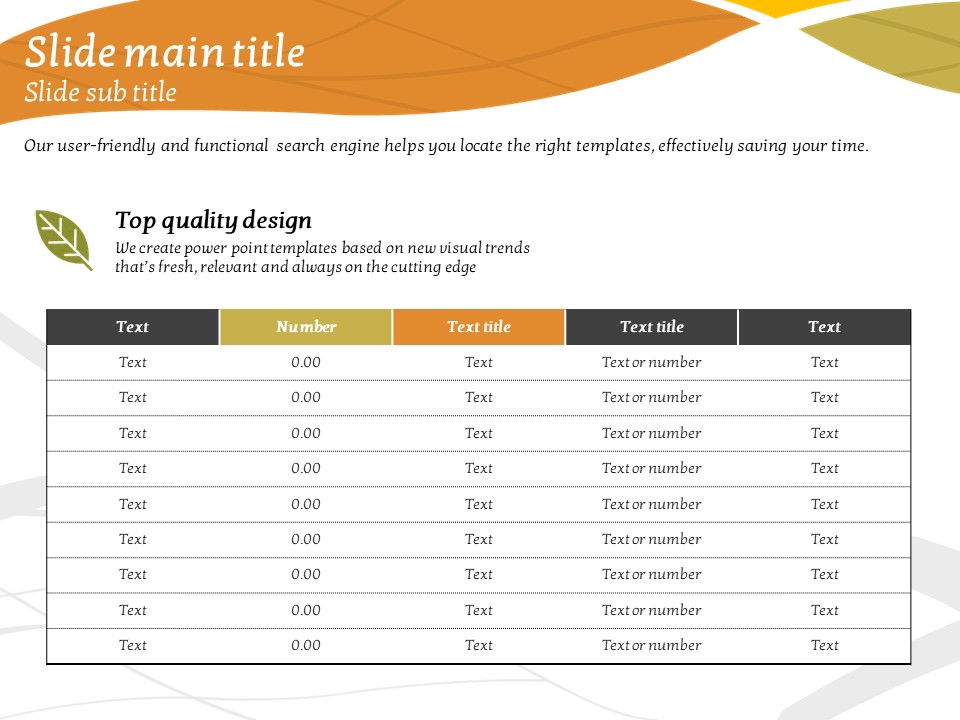
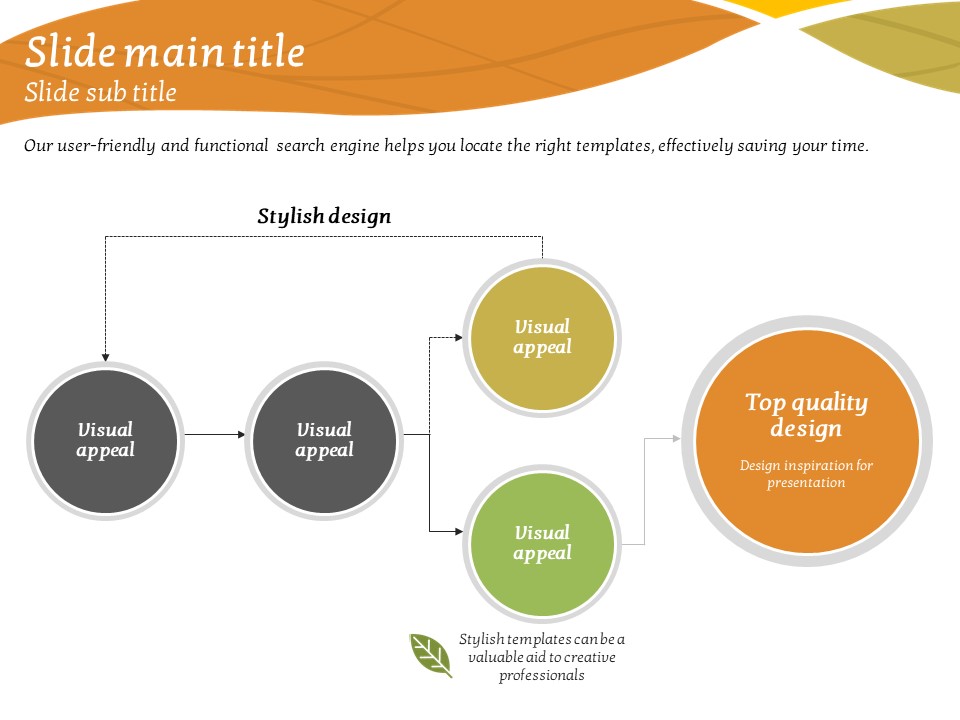
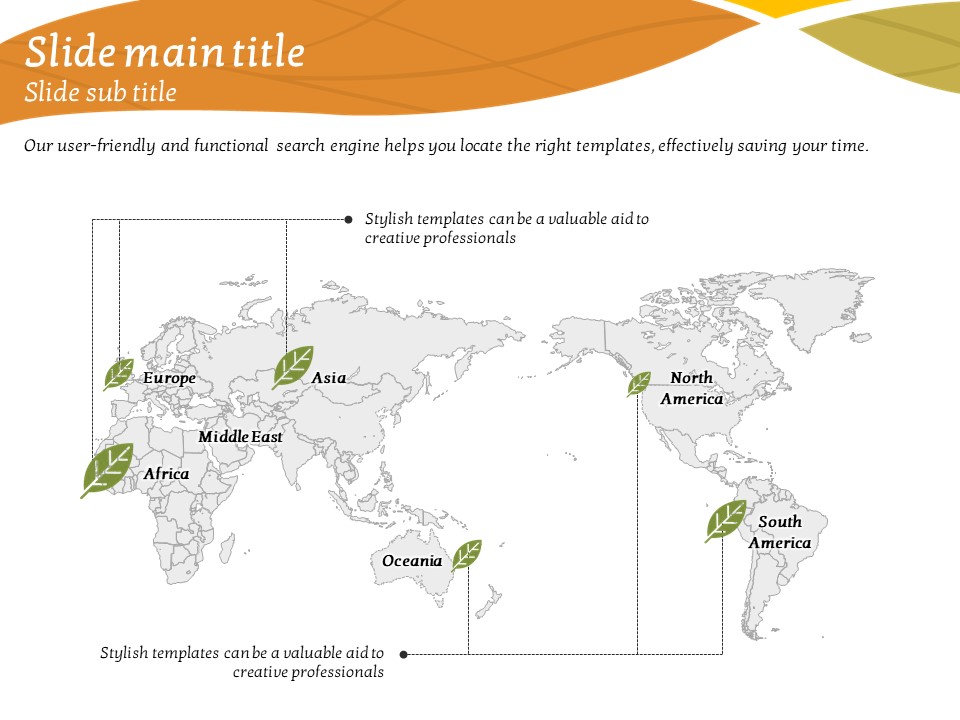
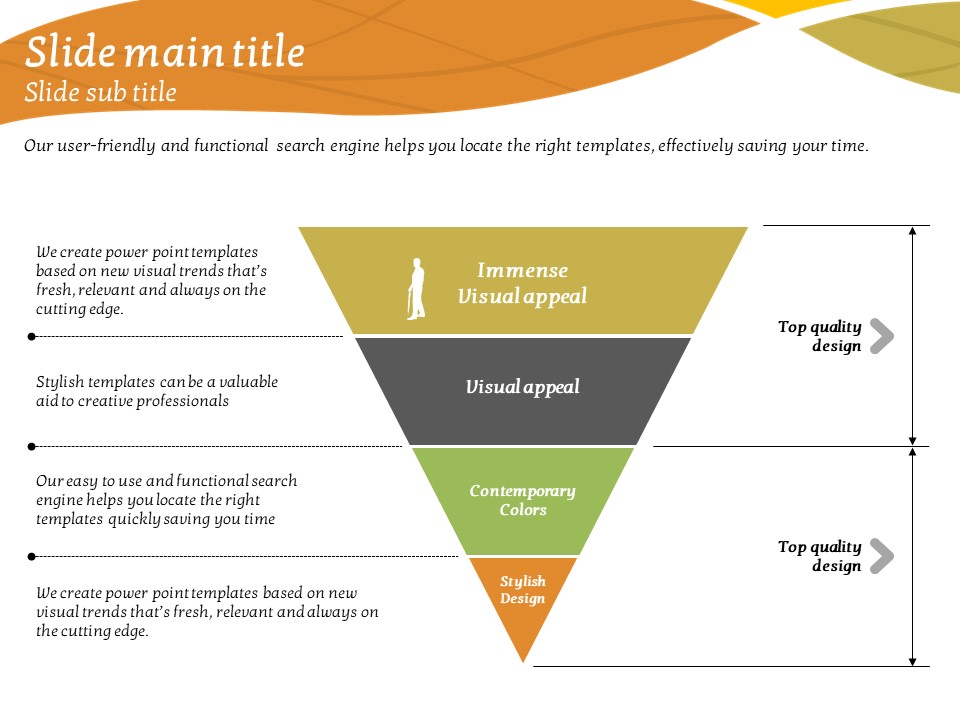
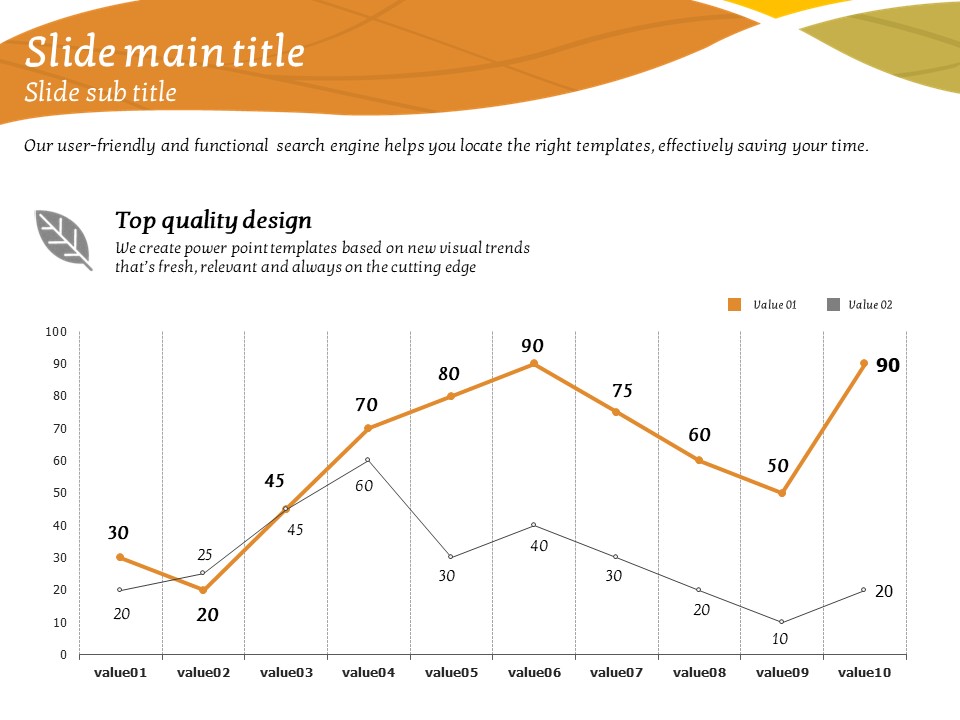
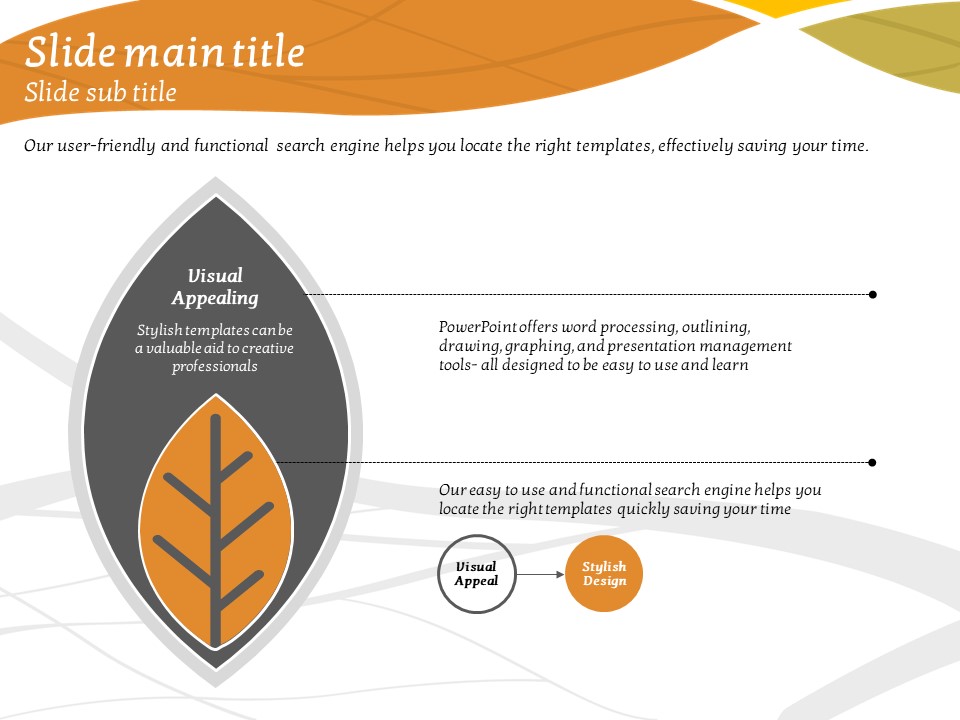
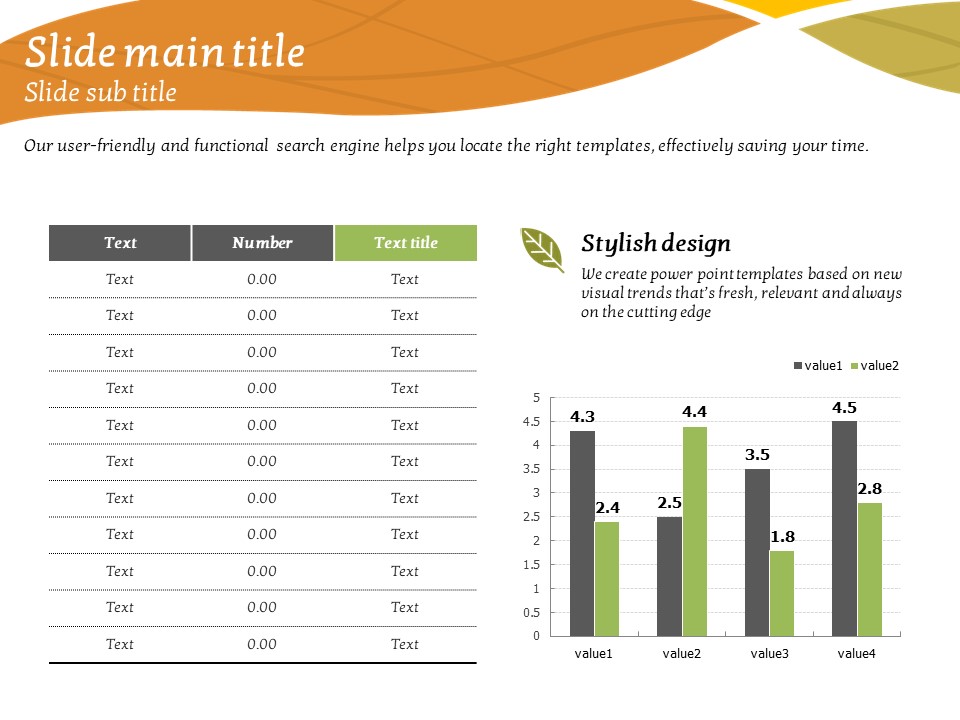
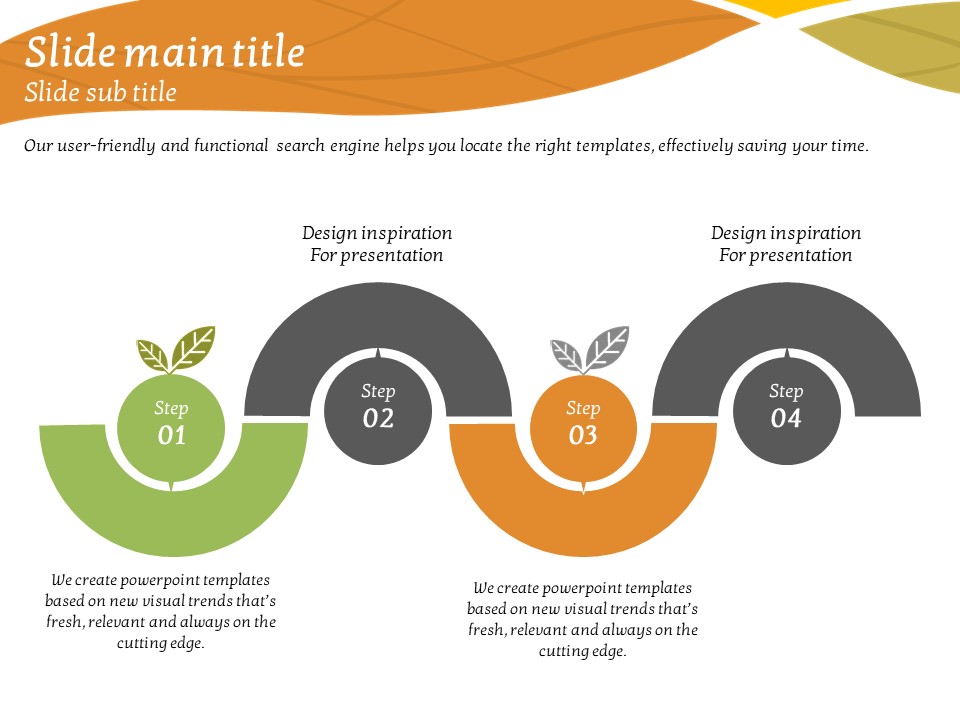
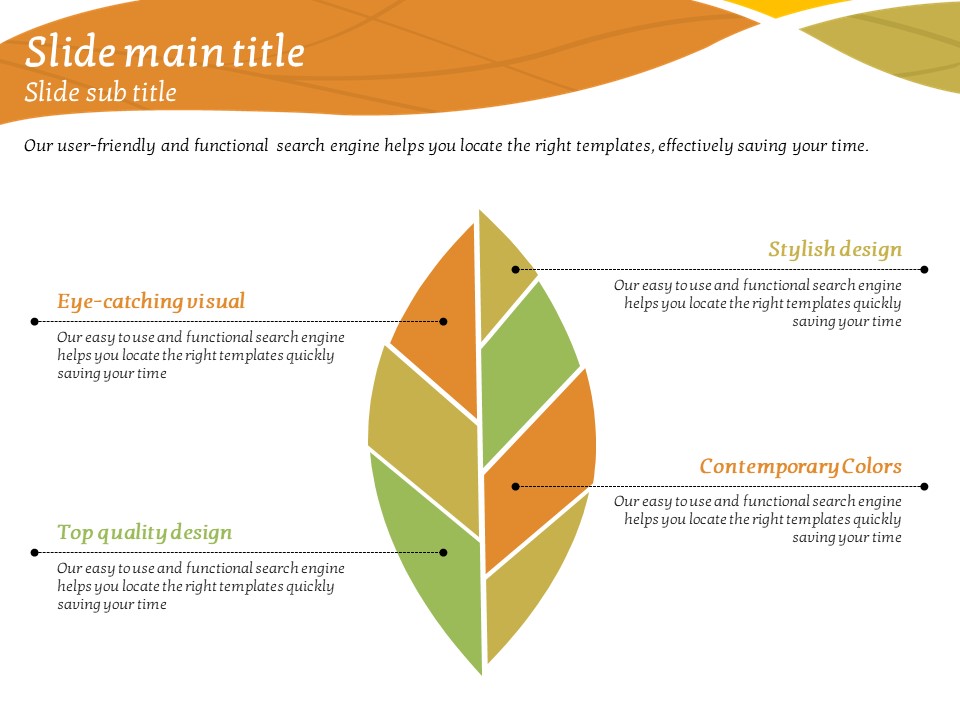
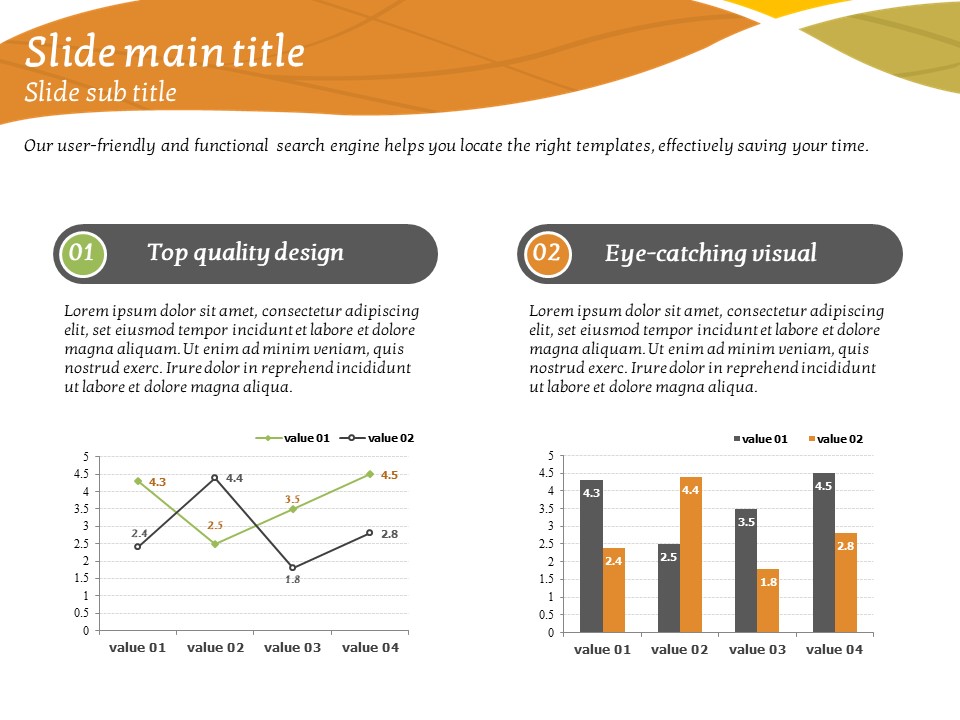
A warm and nature-inspired PowerPoint template designed for retirement and senior-themed presentations. Built around an orange, gold, and olive green earth-tone palette, this template features curved wave shapes and repeating leaf icons that create a welcoming, natural atmosphere throughout the deck. The 20-slide PPTX set includes a variety of ready-to-use layouts: a photo-integrated cover slide with an orange wave background, donut chart comparison slides, a world map infographic with leaf-icon region markers, and a four-tier inverted pyramid diagram in olive, charcoal, green, and orange. All slides are fully editable—replace text, swap images, and adjust colors directly in PowerPoint or compatible presentation software. The 4:3 aspect ratio suits traditional projector setups and printed handouts. Whether you are presenting a retirement celebration program, a senior wellness service, or a community outreach initiative, this slide set delivers a consistent and approachable visual identity across every page.
Usage Points
-
Main Usage
Ideal for retirement celebration events, senior wellness program introductions, elder care service presentations, and any occasion that calls for a warm, nature-friendly visual tone in a professional slide deck.
-
How to Use
Download the PPTX file and open it in PowerPoint. Replace placeholder text and photos with your own content, update chart values directly in the data editor, and adjust the color accents to match your organization's branding if needed.
-
Recommended For
Social welfare coordinators, senior care service planners, retirement consultants, community program managers, and educators working with older adult audiences who need a warm and approachable presentation style.
-
Slide Structure
Includes a cover slide with a senior couple photo and orange wave layout, two-column donut chart comparison slides (40% vs. 60%), a world map infographic with leaf icons marking seven regions, and a four-tier inverted pyramid diagram—20 slides total in 4:3 PPTX format.


