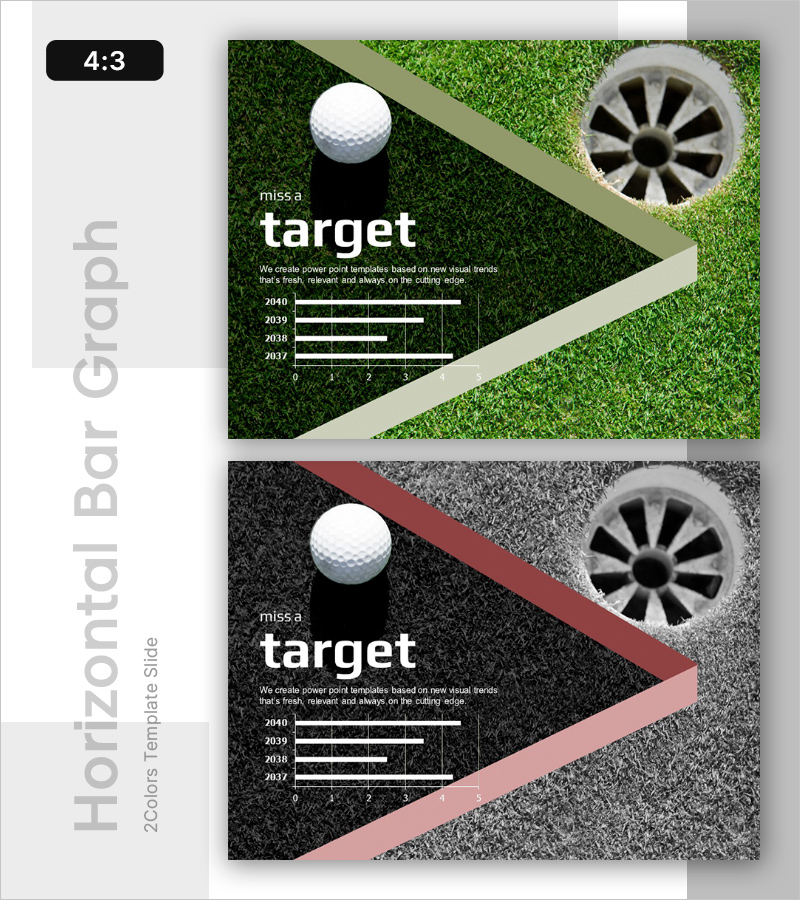
Bar Chart Slide for Visualizing Operational Targets
RL0100028_3
- Last Update 01/20/2025
- File Size 5.4MB
- # of Slides 2
- File Format PPTX
- Slide Ratio 4:3
- Color
Keywords
About the Product
A PowerPoint slide that visualizes year-over-year operational targets using horizontal bar charts. This 2-slide set offers two color options: green and gray backgrounds, each featuring a title area, descriptive text, and a 4-year data bar chart (2037–2040). The unique visual design incorporates golf ball and hole imagery to emphasize the concept of goal achievement, making it ideal for presenting performance metrics and operational plans in presentations. Provided in fully editable PPTX format optimized for 4:3 aspect ratio.
Usage Points
-
Main Usage
This slide enables quick comparison of year-over-year operational targets, performance indicators, and goal progress rates. The horizontal bar chart intuitively represents multi-year numerical data, supporting decision-making in executive reports, business performance presentations, and operational planning sessions.
-
How to Use
Enter your presentation topic (e.g., revenue targets, customer acquisition goals) in the title area and provide context in the descriptive text section. Replace the chart years and values with your actual data for immediate use. Select the color option (green or gray) that best matches your presentation's tone.
-
Recommended For
Ideal for executives, business managers, marketing teams, and financial analysts presenting quarterly or annual performance reviews, goal achievement assessments, and operational plans. Particularly useful in investor relations materials, executive meetings, and multi-year business planning documents.
-
Slide Structure
Each slide features a title area at the top (miss a target text), descriptive text in the middle section, and a 4-year horizontal bar chart at the bottom (2037–2040). The chart displays target values as horizontal bars with a 0–5 scale X-axis and clear data labels. Golf ball and hole imagery on the left and right reinforce the goal achievement concept visually.


