Market Analysis of Animal and Nature Conservation Activities by Region in the US – Eye-Catching Visual
RJ0600074_21
- Last Update 07/09/2025
- File Size 4.7MB
- # of Slides 2
- File Format PPTX
- Slide Ratio 16:9
- Color
Keywords
About the Product
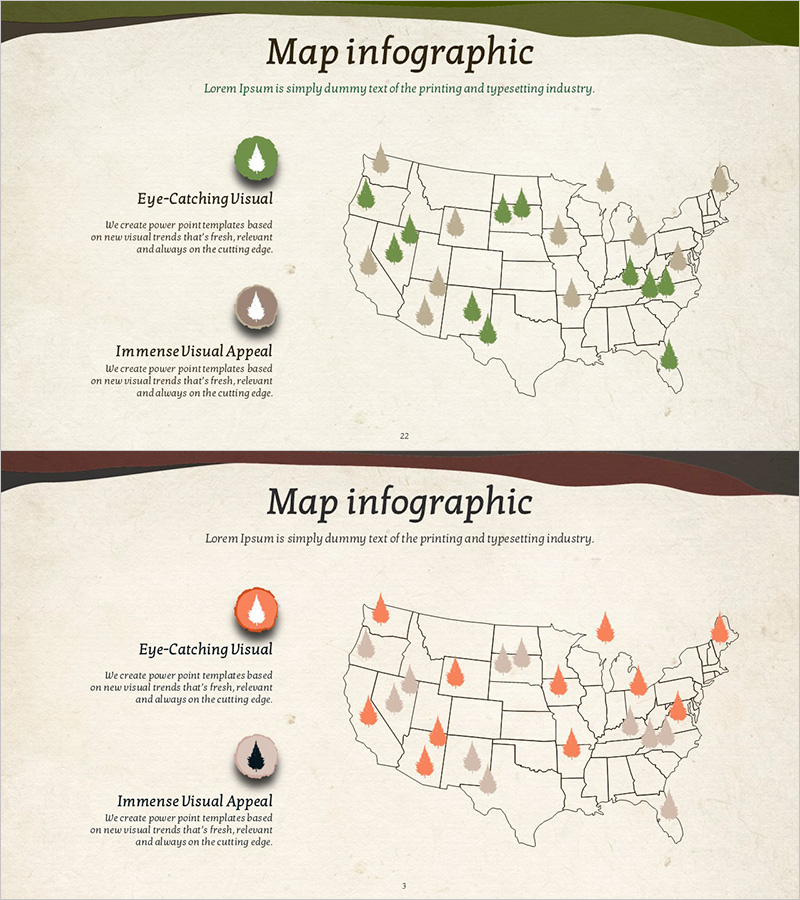
A PowerPoint slide set visualizing US regional market data through map-based infographics. The beige background features a US map with green and orange icons that represent regional data points, enabling intuitive comparison across regions. The 2-slide set provides color variations (green and orange versions) of the same map layout for flexible presentation contexts. Each slide includes a left text area for two key insights and a right map area where icons indicate regional metrics. Ideal for market analysis presentations, regional strategy discussions, and business expansion plans that require geographic data visualization.
Usage Points
-
Main Usage
Visualize regional market conditions, customer distribution, and business expansion opportunities on a geographic map to support strategic decision-making. Effectively communicate geographic insights in marketing strategies, sales plans, and investor presentations where regional comparison is critical.
-
How to Use
Use icon count and color on the map to represent regional metrics (revenue, customer base, market share, etc.). Input two key analysis points in the left text box to explain regional characteristics. Leverage two color variations to represent different datasets or comparison scenarios.
-
Recommended For
Marketing strategy documents, market analysis reports, sales presentations, investor relations (IR) decks, and regional business expansion plans. Recommended for executives, marketing managers, sales leaders, and consultants presenting region-based strategic decisions.
-
Slide Structure
2-slide set with identical US map layout in two color variations (green version and orange version). Each slide features a two-column layout: left text area (accommodates two key points) and right map area with regional icons representing data distribution across US regions.
Related Products
-

Target Market Development Status Graph – Market Analysis and Strategy
#Market and Competitor Analysis #Marketing Plan and Strategy #Graph
-

European Target Market Distribution
#Market and Competitor Analysis #Marketing Plan and Strategy #Graph
-

Target Country Analysis Slide - Market Access Strategy
#Market and Competitor Analysis #Marketing Plan and Strategy #Other
-

Origami Concept Global Map – Market and Competitor Analysis
#Company Introduction #Market and Competitor Analysis #Other
