Step-by-Step Schedule Plan for Sailing Travel Business Project – Cluster Structure
RJ0600072_11
- Last Update 07/09/2025
- File Size 1.3MB
- # of Slides 2
- File Format PPTX
- Slide Ratio 16:9
- Color
Keywords
- #Content-Based Slides
- #Design-Based Slides
- #Business Strategy
- #Business Management
- #Diagram
- #Step-by-Step Schedule Plan
- #Implementation Schedule
- #Cluster
- #Chain Diagram
- #16:9
- #timeline diagram PowerPoint
- #connection diagram slide
- #3-stage process slide
- #project schedule PowerPoint
- #project milestone diagram
- #timeline template PowerPoint
- #how to create timeline in PowerPoint
About the Product
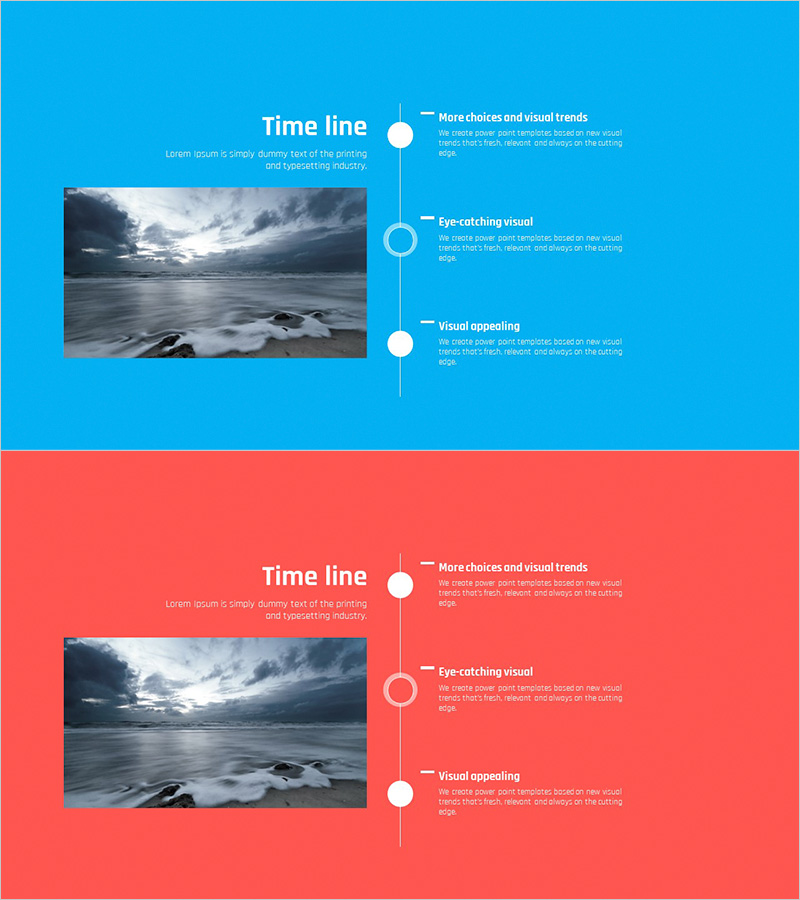
A timeline connection diagram PowerPoint slide that visually represents project phases and schedules with a vertical axis structure. Three nodes (circle, ring, circle) are positioned along a central vertical line with descriptive text connected on the right side, making it ideal for communicating sequential processes such as business strategy, project milestones, and travel itineraries. Available in two color versions—bright blue and coral red—each with ample space for images and text input for immediate editing and use. The 16:9 widescreen format with 2 slides can be directly inserted into the timeline section of presentations.
Usage Points
-
Main Usage
Visualizes sequential processes such as project phases, business implementation timelines, and travel plans in timeline format to clearly communicate the overall flow and key content of each stage to the audience. The center-axis node and right-side text connection structure allows simultaneous representation of progress status and expected outcomes for each phase.
-
How to Use
Enter phase names, dates, responsible parties, and expected results in the text boxes next to each node, and insert representative photos or charts for that phase in the image area. Use the blue version for corporate and technology projects, and the red version for marketing and event planning to match the document's tone naturally.
-
Recommended For
Suitable for use in the timeline and strategy sections of business plans, project proposals, and marketing plans. Particularly recommended for professionals in marketing teams, planning departments, and project management roles working on topics where chronological order is critical, such as travel, tourism, events, product launches, and organizational restructuring.
-
Slide Structure
2-slide composition. Each slide features a title area at the top, a central vertical timeline with 3 nodes in the middle, an image area on the left (approximately 40%), and a text description area on the right (approximately 60%). Nodes vary visually as circle, ring, and circle, connected by vertical lines to emphasize continuity between stages.
Related Products
-

Social Network STEP4 Schedule Planning Diagram
#Business Strategy #Business Management #Diagram
-

Single Slide Template for Visualizing Stages of Lung Cancer
#Business Strategy #Diagram #Step-by-Step Schedule Plan
-

Space Theme Schedule Diagram – Business Strategy Planning
#Business Strategy #Diagram #Step-by-Step Schedule Plan
-

Surgical Drape Theme Connection Diagram - Expressing Business Goals and Strategies
#Business Vision and Strategy #Business Strategy #Diagram
