Introducing Healthy Condiments with a Multidirectional Arrow Diagram – Emphasizing Product Features
RJ0600069_23
- Last Update 07/08/2025
- File Size 5.2MB
- # of Slides 2
- File Format PPTX
- Slide Ratio 16:9
- Color
Keywords
- #Content-Based Slides
- #Design-Based Slides
- #Product/Service Introduction
- #Operational Plan
- #Diagram
- #Features
- #Production and Technology Development Strategy
- #Flow
- #Multidirectional Flow
- #16:9
- #multidirectional arrow diagram PowerPoint
- #comparison analysis slide template
- #upward downward arrow diagram
- #diagram PowerPoint slide
- #trend visualization presentation
- #dual-color comparison slide
About the Product
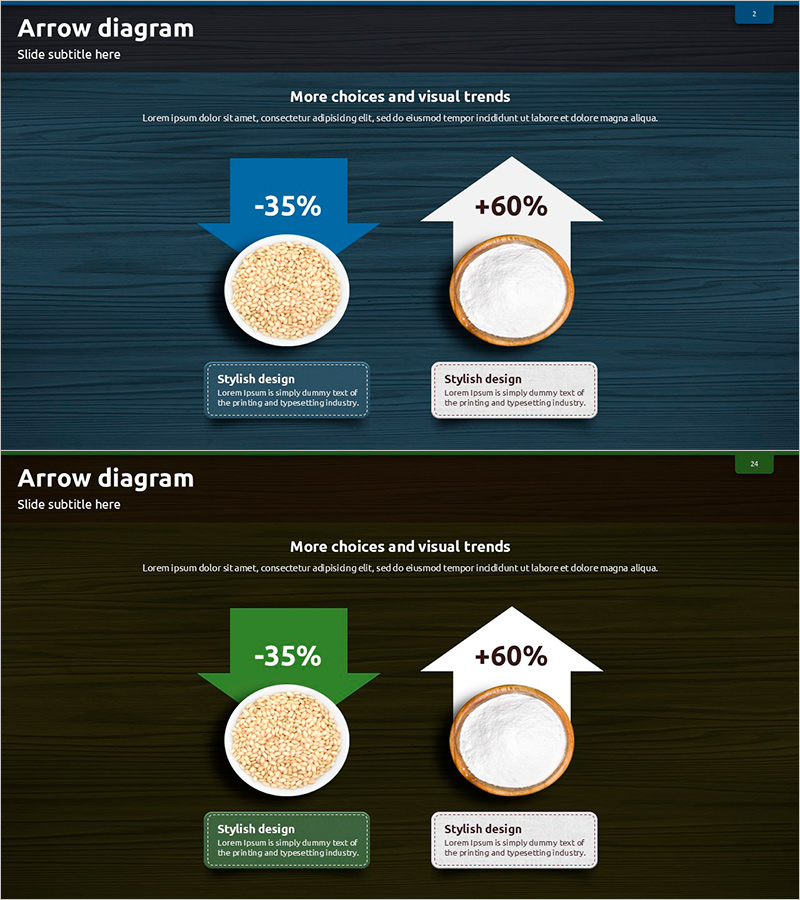
A multidirectional arrow diagram PowerPoint slide that visualizes upward and downward trends simultaneously for comparative analysis. The design features dark blue and olive green backgrounds with white arrows and circular image placeholders, emphasizing contrasting data representation. The 2-slide set maintains consistent layout structure while varying background colors to accommodate multiple data scenarios. Ideal for product feature comparisons, performance metrics, market analysis, and competitive positioning in business presentations. Ready-to-use PowerPoint slide template for executive reports, investor pitches, and strategic planning sessions.
Usage Points
-
Main Usage
Visualizes contrasting metrics and comparative analysis using upward and downward directional arrows. Effectively communicates product feature comparisons, performance gains and losses, market share changes, customer satisfaction metrics, and competitive positioning in a single visual framework.
-
How to Use
Slide 1 features a dark blue background while Slide 2 uses olive green, maintaining identical structure for theme flexibility. Insert product images or icons into the circular placeholders and input percentage values or KPI metrics next to the arrow indicators. Customize text boxes at the bottom for detailed descriptions.
-
Recommended For
Product marketing presentations, sales performance reports, business results analysis, market research findings, financial performance comparisons, and competitive analysis. Particularly effective for executive briefings, investor relations presentations, strategic planning meetings, and scenario comparison discussions.
-
Slide Structure
Each slide contains a title area at the top, two circular image placeholders in the center, left upward arrow (blue or green) and right upward arrow (white) with adjacent metric input fields, and two descriptive text boxes at the bottom for supporting information.
Related Products
-

Optimizing Time Management Strategies – Flow Diagram for Work Efficiency
#Product/Service Introduction #Diagram #Features
-

Interlinked Business Plans – Strategy and Execution
#Product/Service Introduction #Business Strategy #Diagram
-

Recipes with Eggs and Milk – Product and Service Introduction
#Product/Service Introduction #Operational Plan #Diagram
-

Detailed Guidance by Part Slide Template – Efficient Operational Planning
#Product/Service Introduction #Operational Plan #Diagram
