Diet Analysis Graph – Market and Competitor Analysis
RL0100024_4
- Last Update 09/19/2025
- File Size 1.2MB
- # of Slides 2
- File Format PPTX
- Slide Ratio 4:3
- Color
Keywords
About the Product
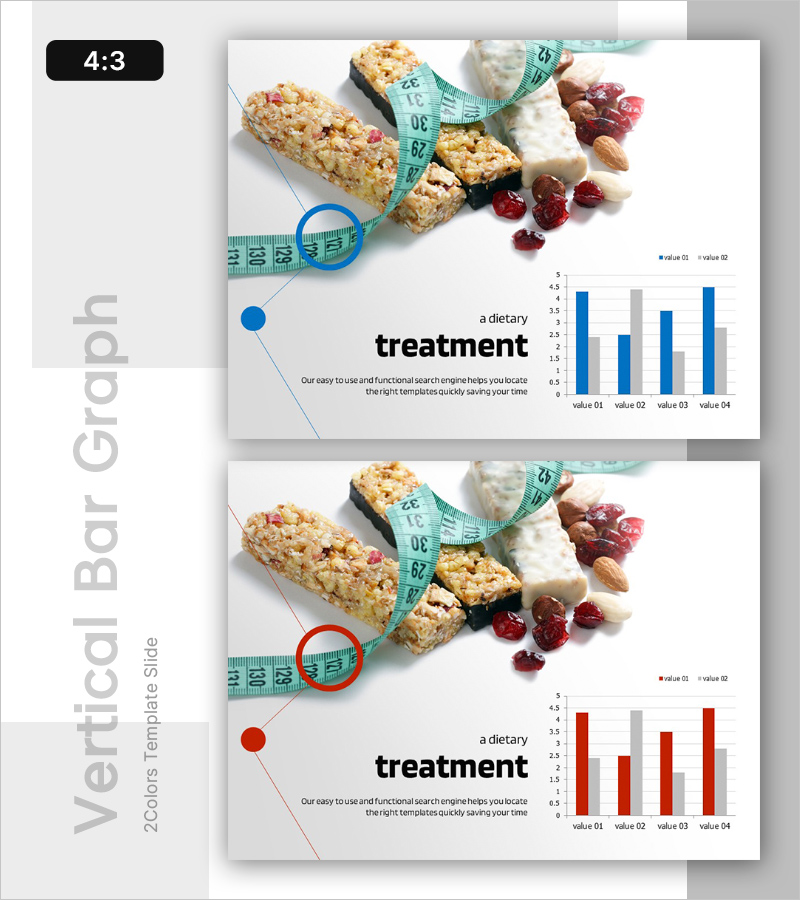
A 2-slide PowerPoint presentation for visualizing dietary treatment effectiveness and health management results. The upper section features a measuring tape and food imagery as background context, while the lower section displays a dual-color bar chart (blue and red) comparing four data values. Each slide uses contrasting color themes to emphasize comparative analysis. This presentation template is ready to use for healthcare, nutrition management, and performance analysis presentations, supporting data-driven decision-making through clear visual representation.
Usage Points
-
Main Usage
Visualize health management programs, dietary treatment outcomes, and nutrition analysis results through quantitative bar charts to deliver clear insights to audiences. The dual-color bar graph emphasizes comparative analysis and supports evidence-based decision-making in healthcare presentations.
-
How to Use
Use in healthcare facilities, nutrition consulting, and wellness program presentations to compare pre/post dietary results, demonstrate client progress, and prove program effectiveness. Customize text areas with specific metrics and analysis findings to match your presentation context and audience needs.
-
Recommended For
Nutritionists, health coaches, medical professionals, wellness center managers, and health program coordinators presenting dietary treatment outcomes to clients, investors, or stakeholders seeking to demonstrate program impact and health improvements.
-
Slide Structure
Upper section: measuring tape, food imagery, and title area / Middle section: analysis description text / Lower section: 4-item dual-color bar chart (value 01–04). Each slide uses distinct color themes to create visual contrast and emphasize comparative data.


