PowerPoint Template Bowing to Authority – Enhancing Recognition and Influence
RL0100023_3
- Last Update 10/19/2025
- File Size 1.6MB
- # of Slides 2
- File Format PPTX
- Slide Ratio 4:3
- Color
Keywords
About the Product
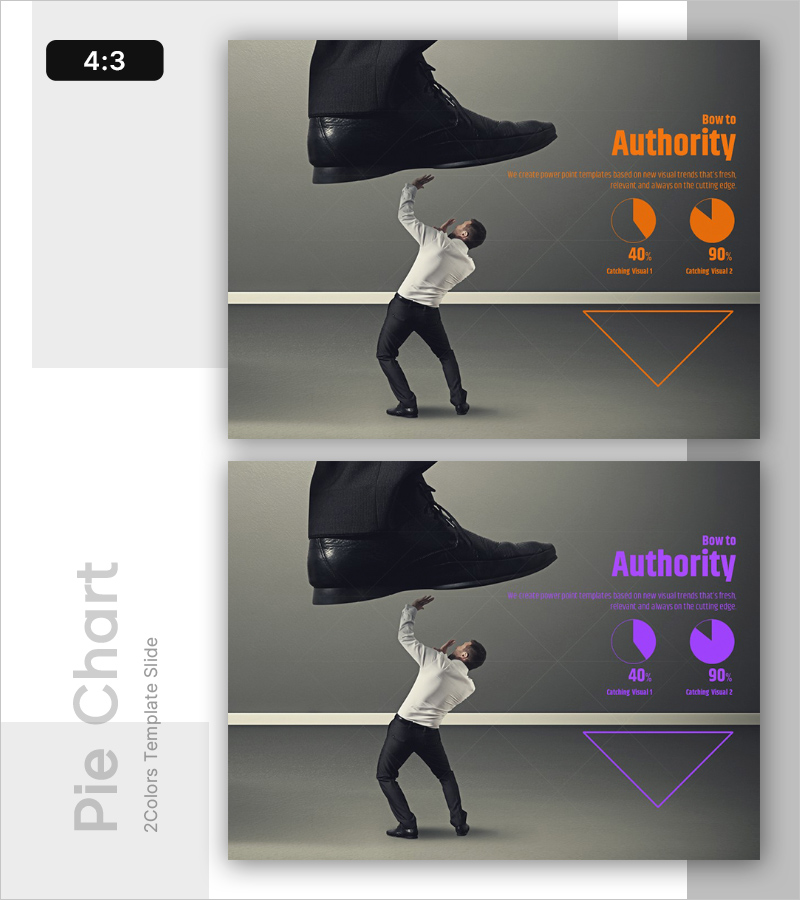
A professional PowerPoint slide that visually communicates authority and market recognition through data-driven design. The 2-slide set features a dark background with orange accent color, positioning an authoritative image and headline at the top, while the right side displays two pie charts showing 40% and 90% metrics. An orange triangle shape at the bottom emphasizes key information and creates clear visual hierarchy. This presentation slide is ready to use for business proposals, performance reports, and investor pitches where demonstrating influence through data visualization is essential.
Usage Points
-
Main Usage
This slide effectively communicates corporate authority and market recognition through quantified metrics. The pie charts visualize specific percentages like 40% and 90%, building audience confidence, while the accent shape highlights your core message. Ideal for investor presentations, partnership proposals, and performance reports where demonstrating market influence and credibility is critical.
-
How to Use
Insert an authoritative visual (logo, product image, or executive photo) in the top image area and add your key message in the right text box. Replace the pie chart percentages with your actual data and adjust the bottom triangle shape color to match your brand palette. Both slides share the same layout, so you can use different accent colors (orange and purple) to create section transitions.
-
Recommended For
Recommended for executives, marketing teams, and sales professionals presenting market share, brand recognition, and performance metrics to investors, partners, and clients. Perfect for company profile presentations, business proposal sections on competitive advantages, and investor relations materials highlighting market position.
-
Slide Structure
The 2-slide set features a consistent layout with an image area at the top (1 element), right-aligned text box (1 element), two pie charts, and a bottom accent triangle (1 element). The 4:3 horizontal format balances text and charts effectively, and color-only modifications allow easy adaptation across multiple presentation topics.
Related Products
-

Nested Round Diagram – Business Vision and Strategy
#Emotional Messages
-

Economic Consumption Template Intro
#Emotional Messages
-

Competitive Sports Template Intro – The Beginning of Strategy and Challenge
#Emotional Messages
-

Competitive Advantage Analysis Bar Chart – Visualization Emphasizing Market Competition
#Emotional Messages
