Triangular Connection Diagram – Visual Value Delivery
RJ0600064_12
- Last Update 07/07/2025
- File Size 0.4MB
- # of Slides 2
- File Format PPTX
- Slide Ratio 16:9
- Color
Keywords
About the Product
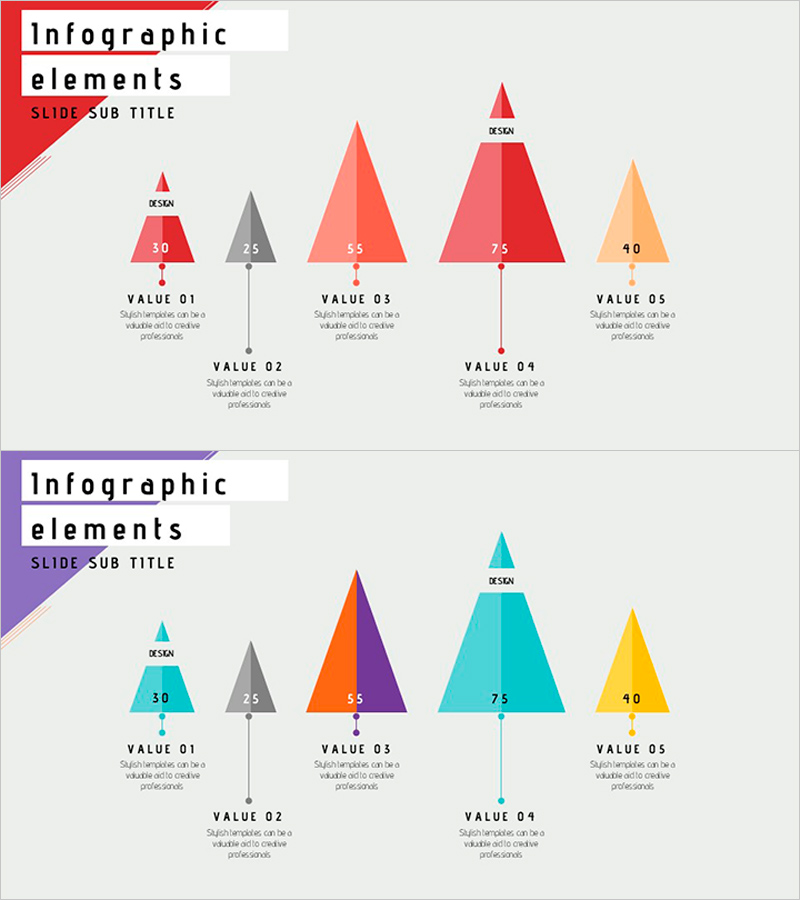
A PowerPoint slide featuring five triangular shapes arranged vertically with connecting lines to visualize step-by-step value comparison. The design uses gradient triangles in red, orange, and gray tones with numerical labels (30, 25, 55, 75, 40) to intuitively express the relative importance of each item. Two color versions are provided: red-tone gradient and multi-color gradient. This presentation template is optimized for business presentations, marketing plans, and strategy reports where data comparison and priority communication are essential. Supplied in 16:9 widescreen PPTX format for immediate editing.
Usage Points
-
Main Usage
Expresses the relative value, importance, and priority of five items simultaneously through triangle size and numerical labels, enabling intuitive data comparison communication. Ideal for marketing performance analysis, product value assessment, and strategy priority discussions in presentations.
-
How to Use
Replace the numerical labels above each triangle with your own data. Enter item names and descriptions in the text areas below (VALUE 01–05). Select a color version matching your corporate brand, and adjust connecting lines and icons to emphasize relationships between items.
-
Recommended For
Marketing, strategy, and finance professionals presenting performance analysis, investment priorities, and product positioning. Effective for executive briefings, client proposals, and internal meetings where complex data requires clear visual representation.
-
Slide Structure
2-slide set. Slide 1: Five red-tone gradient triangles with vertical connecting lines, numerical labels, and five text input areas. Slide 2: Five multi-color (cyan, orange, purple, yellow) gradient triangles with identical structure. 16:9 widescreen format, fully editable PPTX.
Related Products
-

Startup Company Area Diagram – Visualization of Business Introduction
#Company Introduction #Business Introduction #Diagram
-

Future System Differentiation Strategy – Service Development Direction
#Product/Service Introduction #Business Strategy #Diagram
-

Curved Theme Purple Template Diagram – Essential Tool for Business Strategy
#Product/Service Introduction #Business Strategy #Diagram
-

PowerPoint Template for Service Operation Strategy Presentation
#Business Management #Operational Plan #Technical Approach
