Analysis Boxes for Daily Routine - Insights through Data Visualization
RJ0600062_18
- Last Update 07/06/2025
- File Size 3.4MB
- # of Slides 2
- File Format PPTX
- Slide Ratio 16:9
- Color
Keywords
- #Content-Based Slides
- #Design-Based Slides
- #Product/Service Introduction
- #Technical Approach
- #Diagram
- #Program Introduction
- #Service Implementation Plan
- #Cluster
- #Closed Cluster Diagram
- #16:9
- #cluster diagram PowerPoint
- #4-item diagram slide
- #closed cluster diagram template
- #icon-based data visualization
- #analysis diagram PowerPoint slide
About the Product
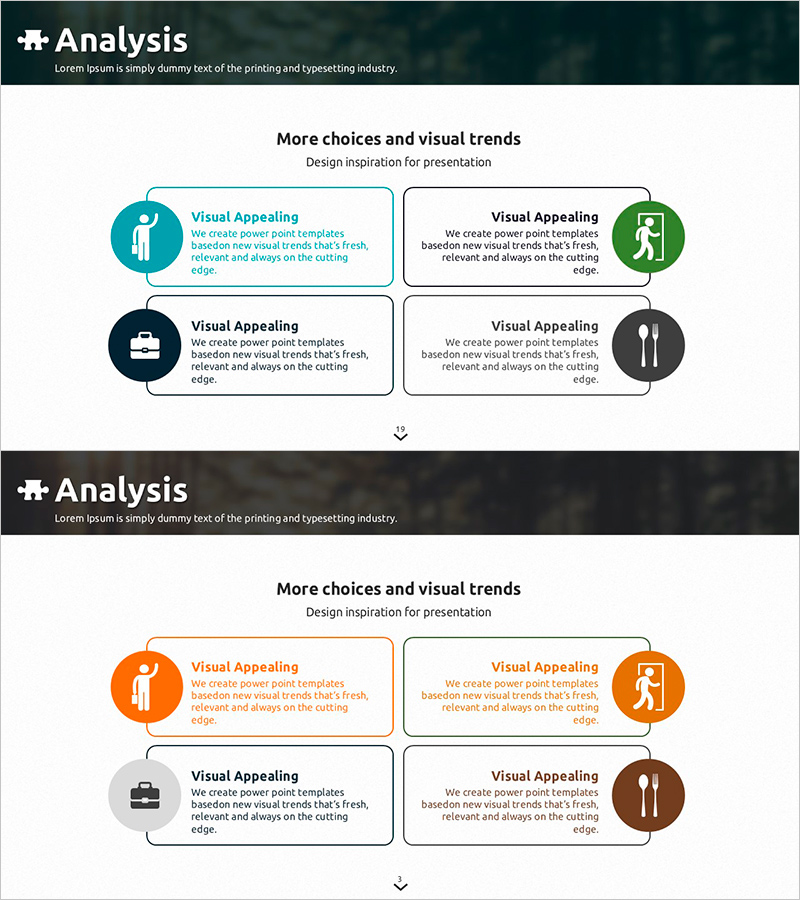
A 4-item closed cluster diagram PowerPoint slide designed for daily routine analysis and data visualization. Four circular nodes are symmetrically positioned around a central concept, each containing an icon and text input area. Four distinct colors—teal, orange, navy, and brown—differentiate each item for visual clarity. Two color variations (teal-navy scheme and orange-brown scheme) allow flexible selection based on presentation context. Optimized for 16:9 widescreen format. Instantly applicable to program introductions, process analysis, organizational role explanations, and comparative data presentations.
Usage Points
-
Main Usage
Designed to display four related items symmetrically around a central concept, enabling instant comprehension of the overall structure. Suitable for daily routine analysis, program component explanations, organizational role assignments, business process 4-phase analysis, and any presentation requiring center-to-periphery relationship visualization.
-
How to Use
Enter the item title and description in each circular node's icon and text area. Select one of two color variations that best matches your presentation theme and tone. With 2 slides included, you can effectively compare and analyze different datasets using the same structural framework.
-
Recommended For
Recommended for marketing and planning teams presenting program overviews, HR and organizational teams explaining role distribution, strategy teams analyzing four key initiatives, operations teams visualizing daily processes, and educators presenting learning component structures.
-
Slide Structure
2-slide set. Each slide features a central concept area with four circular nodes (icon + text input area) positioned symmetrically at top, bottom, left, and right. Slide 1 uses teal-navy-orange-brown color scheme; Slide 2 offers orange-brown-gray-navy variation for flexible presentation styling.
Related Products
-

Pre-Travel Preparation Steps Slide Template – Effective Information Delivery
#Product/Service Introduction #Technical Approach #Diagram
-

Diagram Slide Introducing Fitness Competition
#Product/Service Introduction #Technical Approach #Diagram
-

Introduction to Data Analysis Program – Business Vision and Goals
#Product/Service Introduction #Business Vision and Strategy #Diagram
-

Business Overview Diagram – Success and Strategy
#Product/Service Introduction #Business Vision and Strategy #Diagram
