Adventure Business Indicator Map by Region in the United States – Marketing Strategy
RJ0600055_12
- Last Update 07/05/2025
- File Size 5.8MB
- # of Slides 2
- File Format PPTX
- Slide Ratio 16:9
- Color
Keywords
About the Product
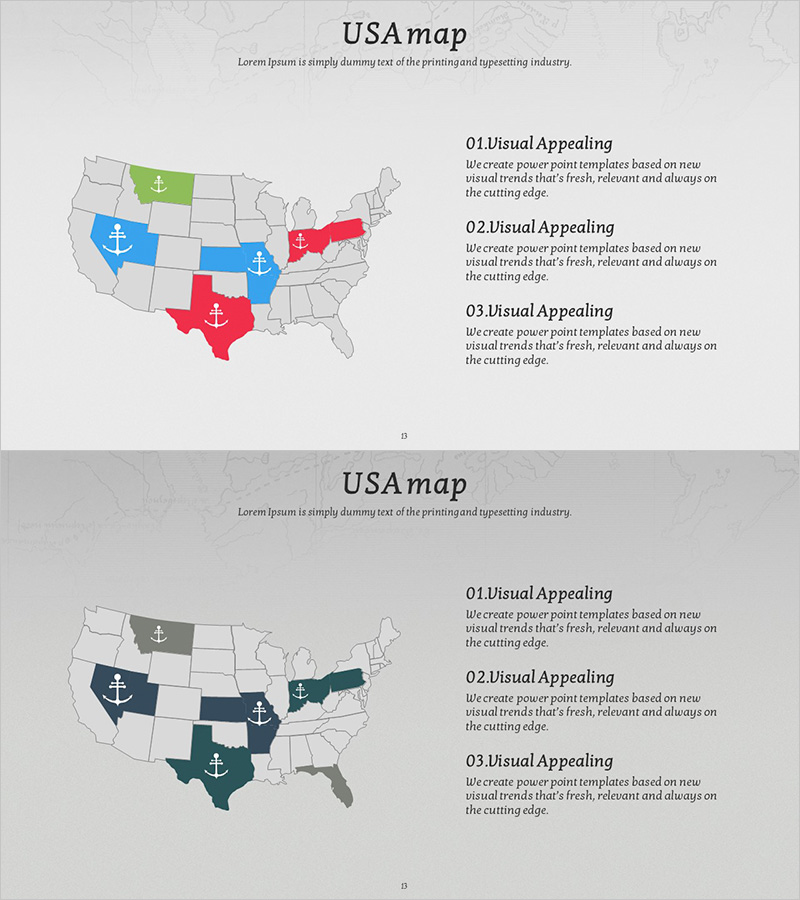
A PowerPoint slide that visualizes business indicators across US regions by dividing the entire United States into geographic areas. The slide uses three distinct colors—green, blue, and red—to differentiate regional status, with anchor icons placed on each state to intuitively represent marketing strategy, market entry plans, and regional performance analysis. The right side features three text description areas where you can detail each region's characteristics. Designed in 16:9 widescreen format optimized for modern presentation environments, this fully editable PPTX template enables quick customization for data-driven regional comparisons.
Usage Points
-
Main Usage
This slide enables analysis of the US market by region and compares business indicators at a glance. The three-color scheme (green, blue, red) intuitively represents each region's status—such as growth, stability, or areas needing improvement—and is ideal for executive briefings on marketing strategy, regional investment planning, and market share analysis.
-
How to Use
Differentiate each state on the left-side USA map using colors to indicate metrics, then populate the right-side text areas with regional descriptions, data, and strategic insights. Use anchor icons to highlight key business hubs, and clearly define the meaning of each color in the three-item section to enhance audience comprehension.
-
Recommended For
Recommended for regional performance presentations by marketing, sales, and strategy teams; investor pitches explaining US market entry strategies; and executive meetings focused on regional strategy development. Particularly effective for global companies, consulting firms, and financial institutions managing US market operations and strategic decision-making.
-
Slide Structure
Comprises a full USA map on the left (showing state boundaries with three-color differentiation), anchor icons in the center, and three text description areas on the right (title + body text). The two-slide set offers different color combinations to support multiple indicator comparison scenarios.
Related Products
-

Target Market Strategy and Analysis Slide – Market and Competitive Analysis
#Market and Competitor Analysis #Marketing Plan and Strategy #Other
-

Marketing Strategy Visualization with US Regional Target Map
#Market and Competitor Analysis #Marketing Plan and Strategy #Other
-

World Map Slide Visualizing Global Country Targets – Sharing Marketing Strategies
#Company Introduction #Marketing Plan and Strategy #Other
-

US Target Market Strategy – Data-Driven Market Analysis
#Market and Competitor Analysis #Marketing Plan and Strategy #Other
