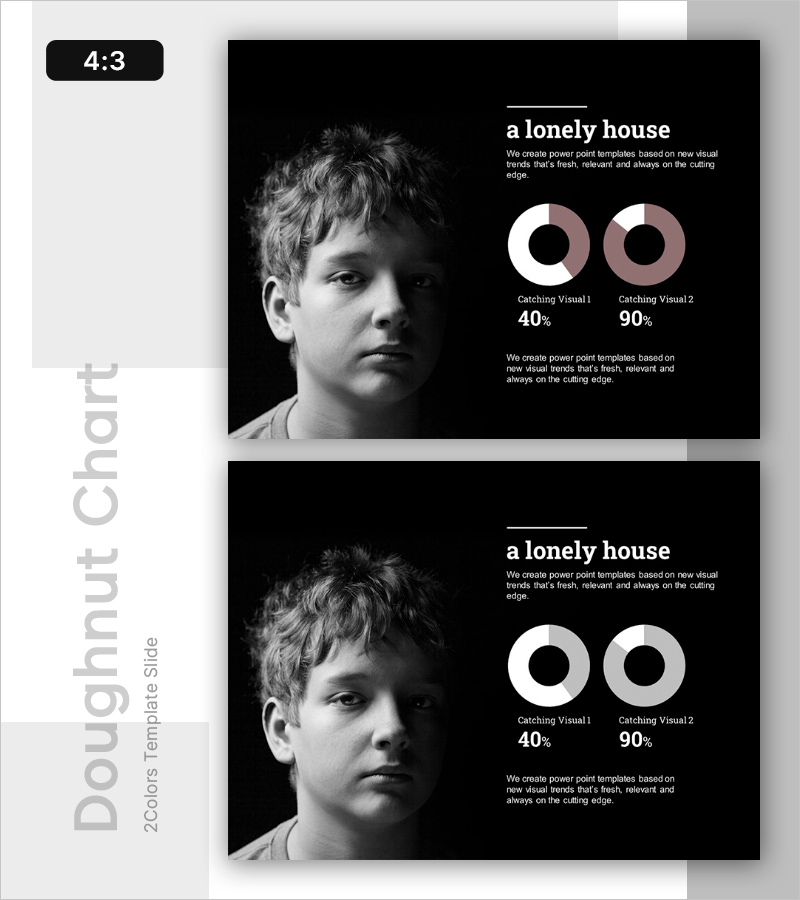
Graph of the Status of Lonely Children at Home
RL0100018_3
- Last Update 01/19/2025
- File Size 0.8MB
- # of Slides 2
- File Format PPTX
- Slide Ratio 4:3
- Color
Keywords
About the Product
A 2-slide PowerPoint presentation designed to visualize emotional states and psychological analysis. The layout combines a monochrome portrait image on the left with two donut charts (40%, 90%) on the right, creating a balanced composition that effectively contrasts different data points. The white typography and beige-toned charts stand out against the black background, ensuring clarity and readability. This slide deck is ideal for emotional status reports, customer sentiment analysis, market research, and psychological assessments. The 4:3 aspect ratio PPTX format allows for immediate editing and customization to match your presentation needs.
Usage Points
-
Main Usage
Visualize emotional states, psychological conditions, customer sentiment, and market research data using donut charts to provide intuitive understanding to your audience. The monochrome portrait image reinforces emotional context and enhances data credibility.
-
How to Use
Enter your analysis topic (e.g., emotional state, customer satisfaction, psychological metrics) in the slide title area. Replace the donut chart values and labels with your actual data. Customize the portrait image to match your target audience or persona for context-specific presentations.
-
Recommended For
Psychological counseling reports, educational assessments, customer sentiment surveys, market research presentations, social condition reports, emotional index analysis, human resource development program evaluations, and any presentation requiring emotional or psychological data visualization.
-
Slide Structure
Two-slide layout with identical structure for consistent visual flow. Each slide features a 40% left-side monochrome portrait image area and 60% right-side content area containing title, descriptive text, and two donut charts. Total of 3 text input areas (title, description, chart labels) and 2 data visualization elements per slide.


