Watercolor Business Goal Connection Diagram - Visualization of Business Strategy
RJ0600049_9
- Last Update 07/04/2025
- File Size 9.7MB
- # of Slides 2
- File Format PPTX
- Slide Ratio 16:9
- Color
Keywords
About the Product
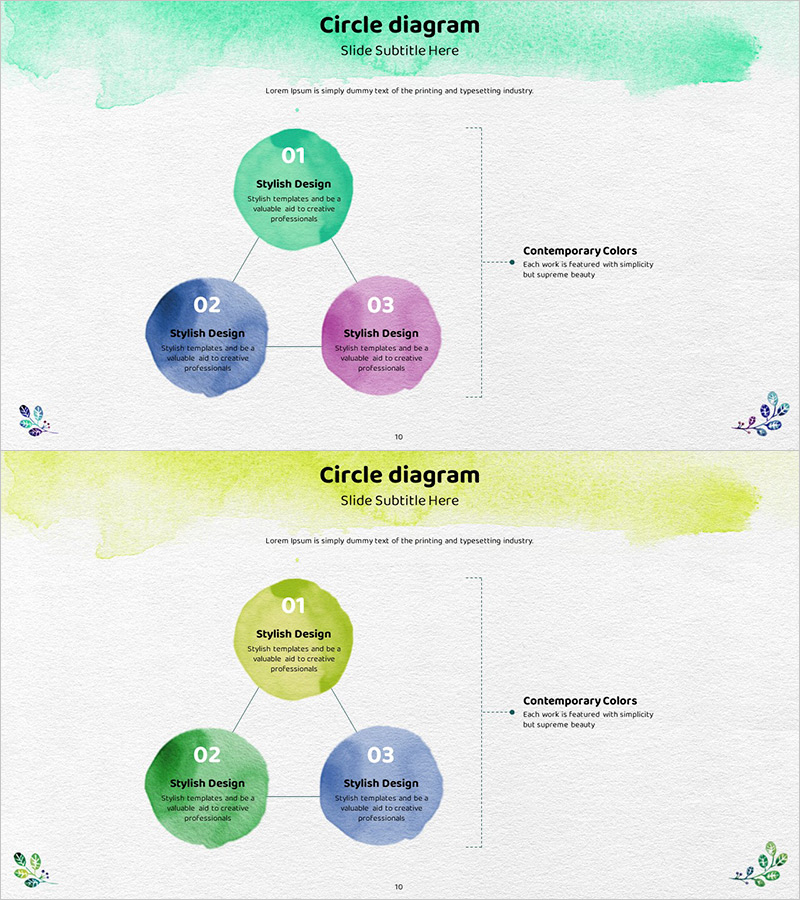
A 3-node connection diagram PowerPoint slide that visualizes business objectives and strategic relationships. Watercolor-toned circular nodes in mint, navy, and magenta are linked by connecting lines to intuitively represent how business goals interact and relate to each other. Each node includes title and description text areas for entering business strategies, core objectives, and execution plans. The 2-slide set offers two color combinations—mint/navy/magenta and lime/green/blue—allowing you to select the palette that best fits your presentation context. Delivered in 16:9 widescreen PPTX format, fully editable and ready to customize.
Usage Points
-
Main Usage
Designed to visually represent the interconnected relationships and interactions between business objectives. Ideal for strategy development phases where you need to define three core goals and clarify their relationships, and for executive briefings or business plan presentations where goal hierarchy must be understood at a glance.
-
How to Use
Enter business objectives, strategies, or execution plans as titles and descriptions in each circular node. The connecting lines represent causal relationships or interactions between goals, so you can arrange them left-to-right (upper goal → mid-level goal → execution goal) or position one central goal with three surrounding strategies radiating outward.
-
Recommended For
Ideal for executives, strategy managers, and business planning teams explaining goal frameworks and strategic roadmaps. Particularly effective in business plans, strategy reports, investment pitch decks, organizational restructuring announcements, and any presentation where goal interconnectedness must be emphasized.
-
Slide Structure
2-slide set. Each slide features 3 circular nodes (approximately 80px diameter) connected by lines. The first slide uses mint/navy/magenta tones; the second uses lime/green/blue tones. Each node contains a number (01, 02, 03), title field, and description text area. A 'Contemporary Colors' legend appears on the right side of each slide.
Related Products
-

Business Connections Circular Diagram – Business Goals and Strategies
#Business Vision and Strategy #Diagram #Business Strategy
-

Key Takeaways from History – Cluster Diagram for Business Vision
#Business Vision and Strategy #Diagram #Business Strategy
-

Key Focus Areas for Service Delivery – Effective Business Objectives Presentation
#Business Vision and Strategy #Diagram #Business Strategy
-

Connected Nested Circle Diagram – Visualizing Business Vision and Strategy
#Business Vision and Strategy #Diagram #Business Strategy
