Renewable Energy Business Report and Review Plan – A Template for Effective Strategic Presentation
RJ0600048_26
- Last Update 07/03/2025
- File Size 1.8MB
- # of Slides 2
- File Format PPTX
- Slide Ratio 16:9
- Color
Keywords
- #Content-Based Slides
- #Design-Based Slides
- #Business Strategy
- #Business Management
- #Text Box
- #Implementation Framework
- #Implementation Plan
- #Rectangle Text Box
- #16:9
- #100% stacked column chart PowerPoint
- #stacked bar chart slide
- #data comparison presentation
- #data visualization PPT
- #chart template PowerPoint
About the Product
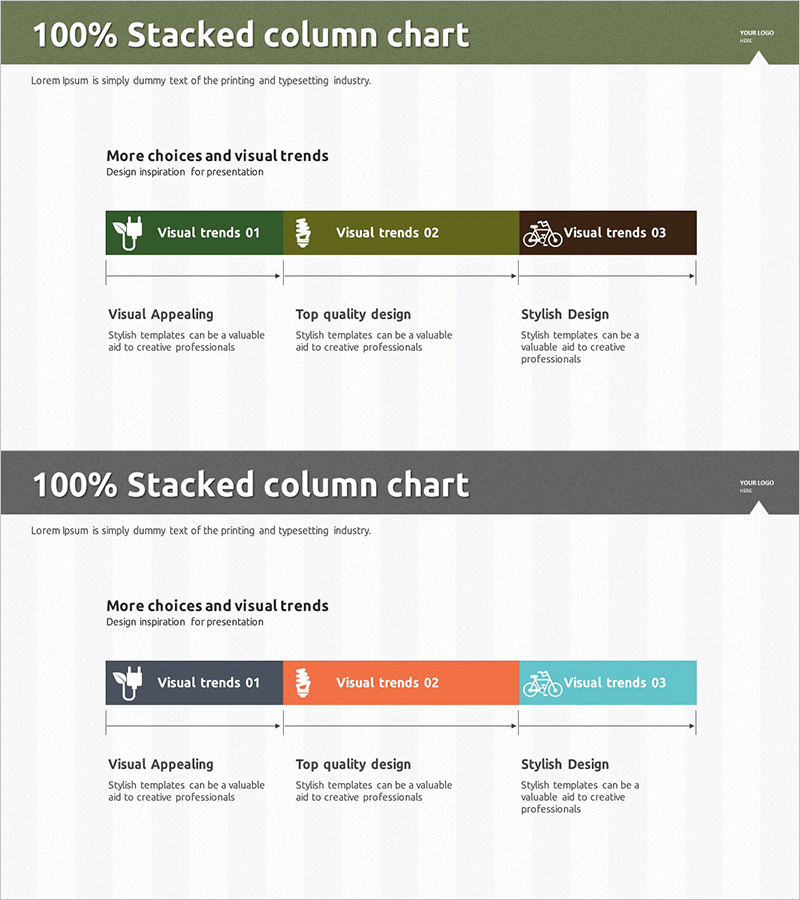
A PowerPoint slide featuring a 100% stacked column chart designed for comparative data analysis across three categories. The layout includes a header section at the top for title and descriptive text, a central chart area with icons representing each data segment, and a three-column detail section below for in-depth explanations. The chart visually represents the proportional composition of each category against a 100% baseline, making it ideal for presenting market share, revenue composition, resource allocation, or customer segmentation. Two color schemes are provided: green and brown tones, or charcoal, orange, and sky blue combinations. The slide is delivered in 16:9 widescreen PPTX format, fully editable and ready for immediate use in presentations.
Usage Points
-
Main Usage
This slide is designed to compare data composition across three categories using a 100% stacked column format. It effectively communicates proportional relationships such as market share distribution, revenue breakdown, resource allocation, or customer segmentation. The visual representation enables audiences to quickly grasp the relative importance of each component and supports data-driven decision-making.
-
How to Use
Enter your analysis topic in the header section and replace the chart data with your actual figures. The chart automatically calculates proportional segments based on your input values. Use the three detail sections below to provide context, explain each category's significance, and highlight key insights that support your analysis.
-
Recommended For
Ideal for financial analysis, market research, business reports, and strategic planning presentations. Suitable for CFOs, marketing managers, executives, and consultants who rely on data-driven insights. Effective for quarterly performance reviews, investor presentations, and executive briefings.
-
Slide Structure
The slide consists of three main sections: a header area (title and descriptive text), a central chart zone with three color-coded segments and icons, and a three-column detail section at the bottom. Each element is independently editable, and chart data changes automatically adjust the proportional color distribution.
Related Products
-

Sewing Stage Visualization – Business Implementation Strategy
#Business Strategy #Business Management #Text Box
-

Idea Derivation Template - Effective Business Strategy
#Business Strategy #Business Management #Text Box
-

Visual Slide of 4-Step Process
#Business Strategy #Business Management #Diagram
-

Step Process Diagram - Clear Flow for Business Strategy
#Business Strategy #Business Management #Diagram
