Analytical Tables and Key Messages Slide – Perfect for Information Delivery
RJ0600046_16
- Last Update 07/03/2025
- File Size 0.5MB
- # of Slides 2
- File Format PPTX
- Slide Ratio 16:9
- Color
Keywords
About the Product
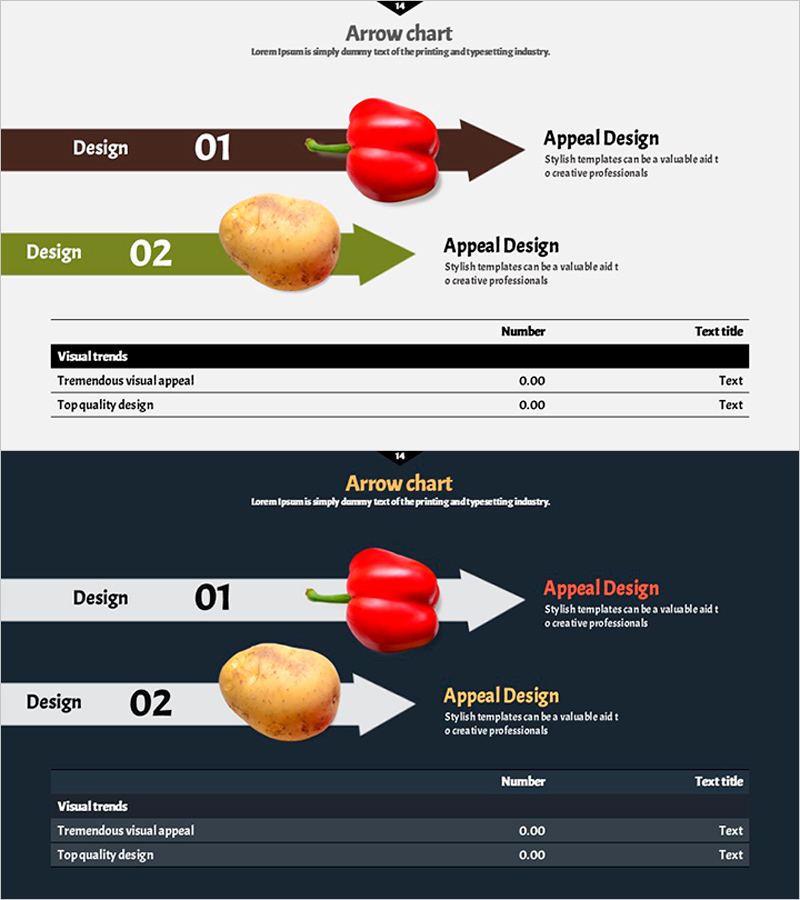
A 2-slide arrow diagram PowerPoint presentation featuring horizontal arrows in brown and green to visualize sequential process flows. Each step includes an image insertion area (shown with red bell pepper and potato examples) paired with a text description section on the right. This design effectively combines analytical tables with key messaging, making it ideal for business presentations that require clear step-by-step information delivery. The slides are formatted in 16:9 widescreen PPTX, ready for immediate use in corporate presentations, proposals, and strategic reports.
Usage Points
-
Main Usage
Visualize sequential processes, cause-and-effect relationships, and step-by-step workflows using arrow diagrams to enhance audience comprehension. Ideal for product development stages, marketing campaign timelines, sales processes, and any business presentation requiring linear flow visualization.
-
How to Use
Insert images or icons into the arrow sections and add step-by-step descriptions in the right-side text boxes. Customize arrow colors to emphasize importance levels, adjust arrow sizes to highlight key stages, or modify text formatting to match your brand guidelines.
-
Recommended For
Marketing managers, project managers, sales executives, consultants, and educators who need to explain processes. Highly applicable in business plans, proposals, strategy reports, training materials, and operational presentations.
-
Slide Structure
2-slide layout with horizontal arrow diagrams on the left side of each slide (brown and green colors), image insertion areas within each arrow, and title/description text boxes positioned on the right. Formatted in 16:9 widescreen PPTX.
Related Products
-

Stylish Design for Distinctive Presentation Support
#Business Strategy #Operational Plan #Diagram
-

Business Competency Circular Diagram – Visualizing Core Strategies
#Product/Service Introduction #Business Vision and Strategy #Diagram
-

Future System Differentiation Strategy – Service Development Direction
#Product/Service Introduction #Business Strategy #Diagram
-

Market Analysis Graph Template – Effective Tool for Competitor Analysis
#Market and Competitor Analysis #Diagram #Graph
