Useful Diagram Slide on How to Choose Healthy Food Ingredients
RJ0600046_12
- Last Update 07/03/2025
- File Size 2.8MB
- # of Slides 2
- File Format PPTX
- Slide Ratio 16:9
- Color
Keywords
About the Product
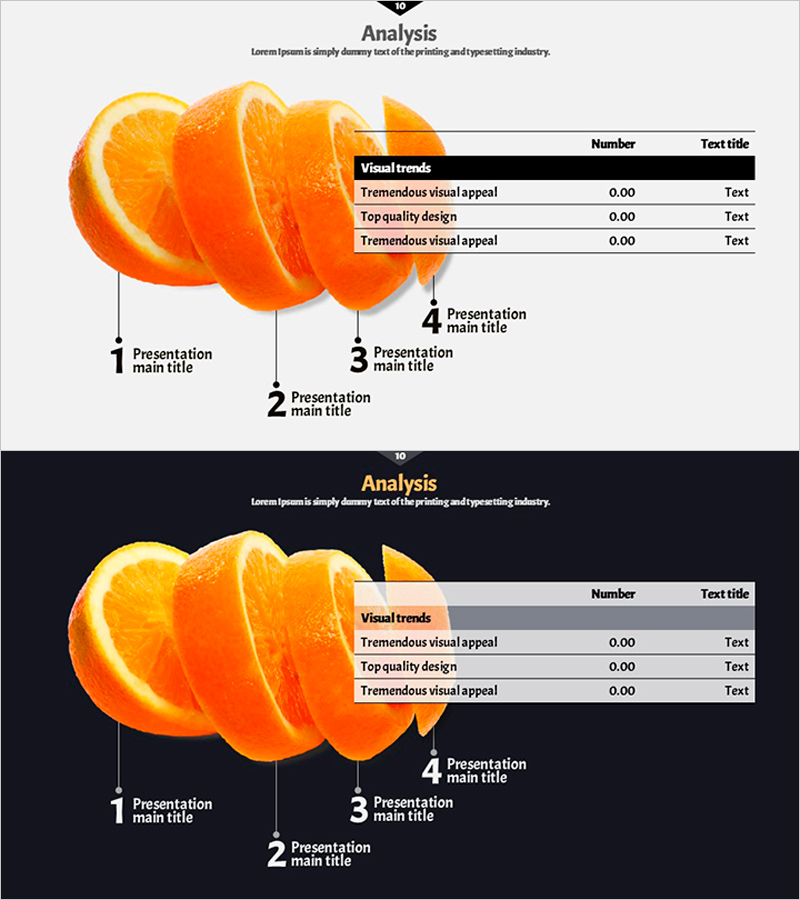
A 2-slide PowerPoint presentation featuring ingredient selection criteria with visual impact. The design combines a vibrant orange slice image with a structured data table displaying four key analysis metrics in a clean, organized format. Perfect for health, nutrition, and food industry presentations. The bright background contrasts with a dark table header, ensuring excellent readability for your audience. Each slide includes dedicated areas for title, subtitle, and four data entry fields, making it easy to customize for your specific presentation or slides deck. Ideal for nutrition education, health product launches, and food safety communications.
Usage Points
-
Main Usage
Present ingredient selection criteria, nutritional analysis, and health information through a structured 4-item comparison table. This data visualization slide transforms complex information into an easy-to-understand format, enhancing audience comprehension and presentation credibility.
-
How to Use
Enter your presentation title and subtitle in the header area. Fill in the four comparison items and corresponding data points in the table rows. Replace the left-side image with your own food or product photo. Customize table and background colors to match your brand guidelines or corporate identity.
-
Recommended For
Food and beverage companies, health and wellness organizations, nutrition education seminars, medical presentations, product launch events, marketing strategy decks, and nutritionist or health coach training materials.
-
Slide Structure
2-slide deck with consistent layout. Each slide features a title and subtitle area at the top, a large image placeholder on the left, and a data table on the right with 4 rows and 3 columns. The table header uses dark background for emphasis, while data rows use light gray for clear visual hierarchy and information distinction.
Related Products
-

Food Calorie Table PowerPoint – An Effective Tool for Health Management
#Product/Service Introduction #Diagram #Composition
-

Tree PPT Year-by-Year Table – Market and Competitor Analysis
#Product/Service Introduction #Market and Competitor Analysis #Diagram
-

Product Composition Table Slide – Clarity and Practicality
#Product/Service Introduction #Diagram #Composition
-

Product Top Sales Analysis Graph – Market and Competitor Analysis
#Business Strategy #Market and Competitor Analysis #Diagram
