Infographic Map by ABC Type – Global Network Analysis
RJ0600042_19
- Last Update 07/02/2025
- File Size 0.8MB
- # of Slides 2
- File Format PPTX
- Slide Ratio 16:9
- Color
Keywords
- #Content-Based Slides
- #Design-Based Slides
- #Company Introduction
- #Market and Competitor Analysis
- #Other
- #Global Network
- #Target Market
- #16:9
- #global map PowerPoint slide
- #world map infographic presentation
- #market analysis map slide
- #regional distribution chart PPT
- #how to create a global network map in PowerPoint
About the Product
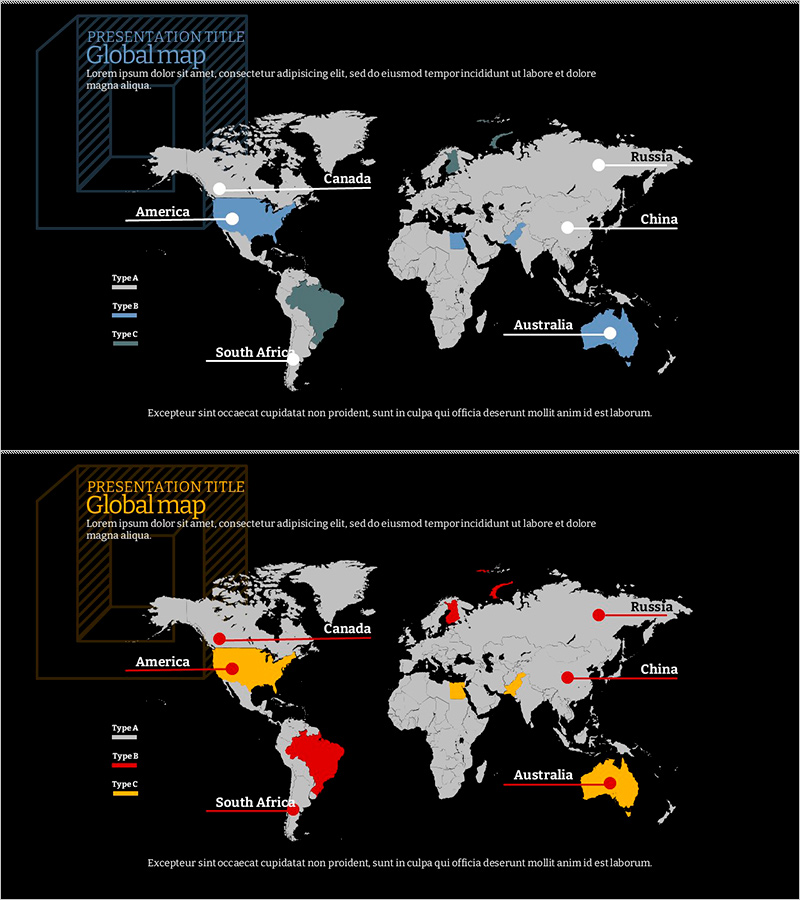
A world map-based infographic PowerPoint slide that visualizes global networks and market distribution at a glance. Featuring two distinct layouts: the first uses a blue minimalist style highlighting key regions (America, Canada, Russia, China, Australia, South Africa), while the second categorizes regions by ABC type with color-coded markers. The dark background with white typography and colored accent points ensures excellent presentation readability. Provided in fully editable PPTX format optimized for 16:9 widescreen displays, allowing you to customize region names, data labels, and marker colors to match your specific market analysis.
Usage Points
-
Main Usage
Communicate international market conditions, global network distribution, and regional business performance in a single visual. The world map foundation emphasizes key geographic hubs while color-coded ABC type categorization clearly represents market segmentation across regions.
-
How to Use
Use in investor presentations, market analysis reports, and global business strategy meetings to explain regional market status. Input company names, region labels, and statistical data into text fields, then adjust marker colors to match your specific dataset and presentation theme.
-
Recommended For
Ideal for executives, marketing managers, business development teams, and investor relations professionals. Particularly effective when presenting global expansion strategies, international partnerships, regional revenue performance, and market entry plans.
-
Slide Structure
Two-slide layout: the first slide features a single blue color scheme with five key regions marked by point indicators in a minimalist design; the second slide uses three distinct colors (red, orange, blue) to categorize regions by ABC type, showing classification distribution. Both slides include title area, legend section, and interactive map region for data customization.
Related Products
-

Infinite Energy Wide PPT Map - Global Network Analysis
#Company Introduction #Market and Competitor Analysis #Other
-

Global Market Distribution Visualization – Effective Market Analysis
#Company Introduction #Market and Competitor Analysis #Other
-

Idea Development Status by Country – Global Network Analysis
#Company Introduction #Market and Competitor Analysis #Other
-

Key Services by Country Visualization – Global Network
#Company Introduction #Market and Competitor Analysis #Other
