Selecting Global Market Targets – Cluster Diagram for Global Networking
RJ0300090_15
- Last Update 05/14/2025
- File Size 0.7MB
- # of Slides 2
- File Format PPTX
- Slide Ratio 16:9
- Color
Keywords
- #Content-Based Slides
- #Design-Based Slides
- #Company Introduction
- #Market and Competitor Analysis
- #Diagram
- #Other
- #Global Network
- #Target Market
- #Cluster
- #Chain Diagram
- #16:9
- #cluster diagram PowerPoint
- #global network slide template
- #world map presentation
- #city connection diagram
- #international market analysis PPT
About the Product
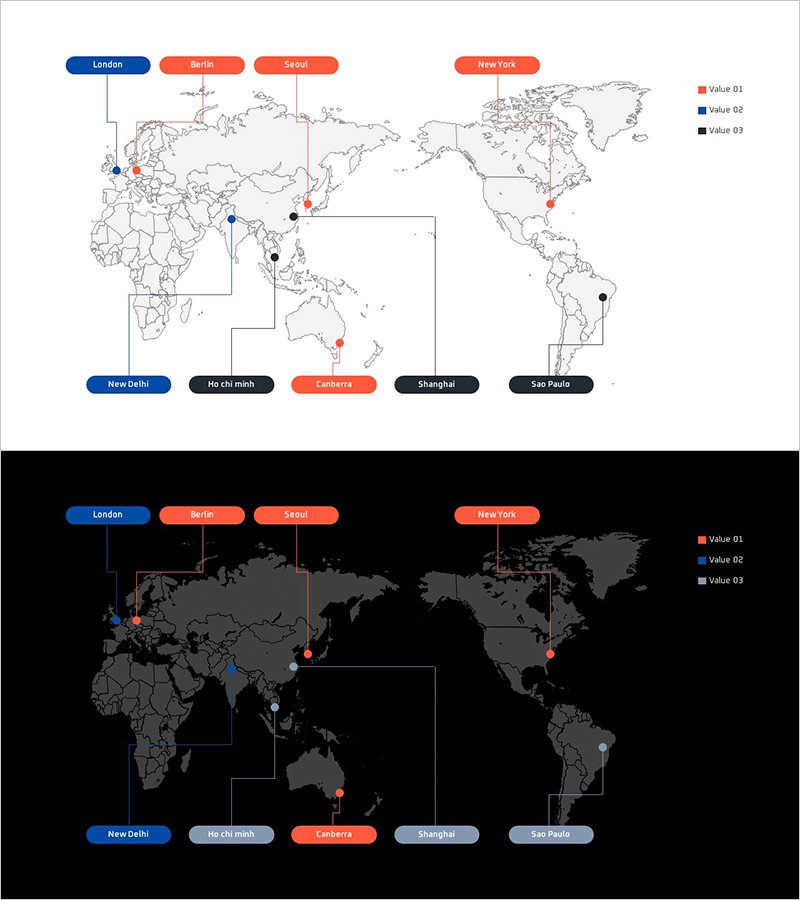
A cluster diagram PowerPoint slide that visualizes global market expansion strategy and international networking. This slide features a world map with eight major cities—London, Berlin, Seoul, New York, New Delhi, Ho Chi Minh City, Canberra, Shanghai, and São Paulo—represented as nodes and connected by lines to illustrate global network structure. Three value categories (red, blue, black) distinguish city importance levels, while vertical and horizontal connection lines clarify inter-regional relationships. Two versions provided with light and dark backgrounds to suit any presentation environment. The 2-slide set is ready to use in global strategy presentations, market analysis reports, and international business proposals.
Usage Points
-
Main Usage
Designed to communicate global market entry strategies, international network expansion, and regional business connectivity at a glance. The world map with nodes and connection lines simultaneously conveys city relationships and priority levels, effectively presenting your global vision to executives, investors, and business partners.
-
How to Use
Insert into the market analysis section of business plans, global strategy slides in investor pitch decks, or network overview pages in company presentations. Freely edit city names and connection lines to reflect your actual offices and partners. Modify color values to distinguish priority levels or business phases.
-
Recommended For
Global company executives, international business managers, marketing teams developing overseas expansion strategies, consulting firms building multinational networks, and finance, IT, and manufacturing professionals presenting international collaboration projects.
-
Slide Structure
2-slide set. Each slide features a world map background with 8 major cities as circular nodes connected by straight lines forming the network. A legend displays three value categories (Value 01, 02, 03) in distinct colors. City name labels in tab format at the top clarify the hierarchical structure.
Related Products
-

Visualizing Global Journey Slide – Harmony of Blue and Pink
#Company Introduction #Market and Competitor Analysis #Diagram
-

Stylish Graphic World Map Slide
#Company Introduction #Market and Competitor Analysis #Diagram
-

Target Country User Analysis Map
#Company Introduction #Market and Competitor Analysis #Graph
-

Blue Green Global Map – Connecting the World
#Company Introduction #Market and Competitor Analysis #Other
