Layer Structure Infographic – Clarity of Information
RJ0600041_4
- Last Update 07/02/2025
- File Size 0.3MB
- # of Slides 2
- File Format PPTX
- Slide Ratio 16:9
- Color
Keywords
About the Product
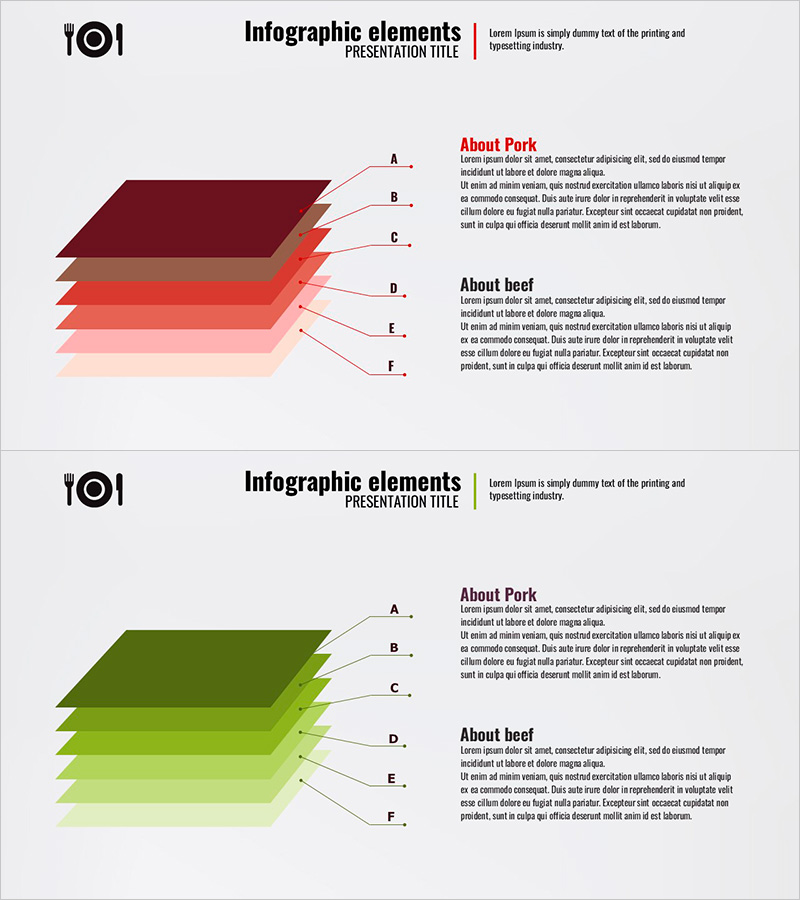
A 6-layer structure diagram PowerPoint slide that clearly expresses information hierarchy with two color variations: wine tone and green tone. Each layer features gradient shading to create visual depth, with labeled reference points (A–F) for detailed explanations. Provided in 16:9 widescreen PPTX format, ready for immediate editing. Ideal for business analysis presentations, product structure explanations, organizational hierarchy visualization, and strategic planning decks. The dual-color design allows you to emphasize different messaging contexts—wine for authority and professionalism, green for growth and positivity.
Usage Points
-
Main Usage
Breaks down complex information structures into hierarchical layers, helping audiences understand step-by-step progression. Color-coded layers visually prioritize information, while labeled reference points (A–F) enable detailed explanations for each tier, strengthening logical flow and comprehension.
-
How to Use
Present each layer sequentially during your talk, or display the complete structure at once for overview. Insert corresponding text into the explanation area on the right side of the slide for points A through F. Choose the wine-tone version to emphasize trust and expertise, or the green-tone version to convey growth and optimism.
-
Recommended For
Business analysts, management consultants, product managers, and marketing professionals explaining market structures, organizational hierarchies, product portfolios, or supply chains. Effective for investor presentations, strategic reports, and product launch decks where reducing information complexity and increasing audience comprehension are priorities.
-
Slide Structure
2-slide set. Each slide features a 6-layer hierarchical diagram on the left with labeled reference points (A–F), and a text explanation area on the right. Slide 1 uses wine-tone gradient (dark wine to light wine), Slide 2 uses green-tone gradient (dark green to light green), providing flexible color options for different presentation contexts.
Related Products
-

Major Clients Partnerships Diagram – Visual Appeal and Efficiency
#Company Introduction #Diagram #Customers and Partners
-

Medical Core Values and Representative Introduction PowerPoint Template
#Company Introduction #Diagram #Introduction of Executives
-

Picture Tool Diagram on a Hardwood Background – Style and Innovation
#Product/Service Introduction #Business Introduction #Diagram
-

Marketing Effectiveness Analysis Diagram – A Visual Overview for Effective Business Execution!
#Business Management #Operational Plan #Diagram
