Analysis Diagram by Meat Type – Quality Design and Visual Appeal
RJ0600041_17
- Last Update 07/01/2025
- File Size 0.3MB
- # of Slides 2
- File Format PPTX
- Slide Ratio 16:9
- Color
Keywords
About the Product
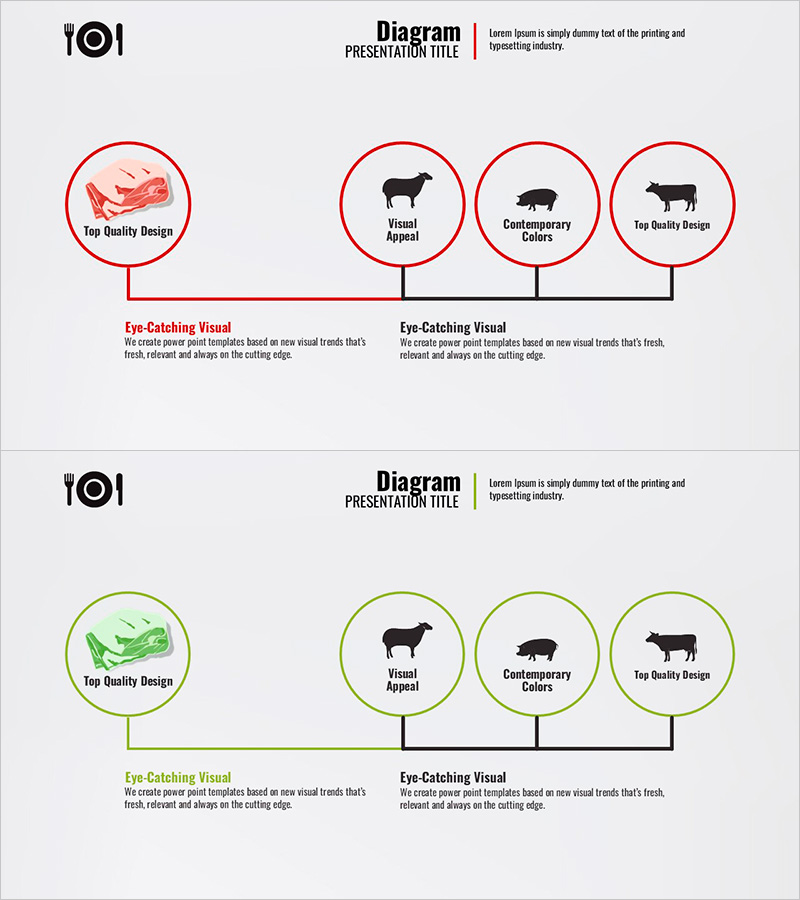
A radial connection diagram PowerPoint slide featuring a central concept expanding to four surrounding items. This presentation template uses red and green two-tone circular nodes connected by straight lines to represent meat type characteristics (visual appeal, contemporary colors, quality design, premium quality). The 2-slide set includes both red and green color theme versions, with icons and text placed inside each node for enhanced information delivery. Optimized for 16:9 widescreen format and ready for immediate editing and use.
Usage Points
-
Main Usage
Visualizes core product or service characteristics by expanding from a central concept to four detailed items. Ideal for meat type analysis, service structure diagrams, brand value deployment, business domain classification, and other business contexts requiring hierarchical relationship visualization.
-
How to Use
Enter your core concept (e.g., meat type) in the central node and place four sub-items (e.g., visual appeal, colors, design, quality) in the surrounding nodes. Choose between red or green color theme versions based on your presentation topic. Freely edit text and icons to match your content.
-
Recommended For
Recommended for product marketing presentations, service structure explanations, brand positioning, business domain classification, organizational structure diagrams, and strategic reports. Suitable for sales teams, marketing departments, and executive presentations.
-
Slide Structure
2-slide set. Each slide features one central circular node with four surrounding circular nodes in radial arrangement. Straight connecting lines between nodes express hierarchical relationships. Two color theme versions (red and green) are provided. 16:9 widescreen PPTX format.
Related Products
-

Technical Aspects of the Performance – Immersive Experience Through Lighting and Sound
#Technical Approach #Diagram #Service Components
-

From Strategy to Execution – Systematic Approach Using Service Diagram
#Technical Approach #Diagram #Service Architecture Diagram
-

Orbital Style Diagram – Connection and Innovation
#Technical Approach #Diagram #Service Architecture Diagram
-

Service Structure and Benefits Explanation – Communicating Business Value
#Technical Approach #Diagram #Service Architecture Diagram
