Yellow Red Highlight Table Chart – Business Insights
RJ0600039_18
- Last Update 07/01/2025
- File Size 2.6MB
- # of Slides 2
- File Format PPTX
- Slide Ratio 16:9
- Color
Keywords
About the Product
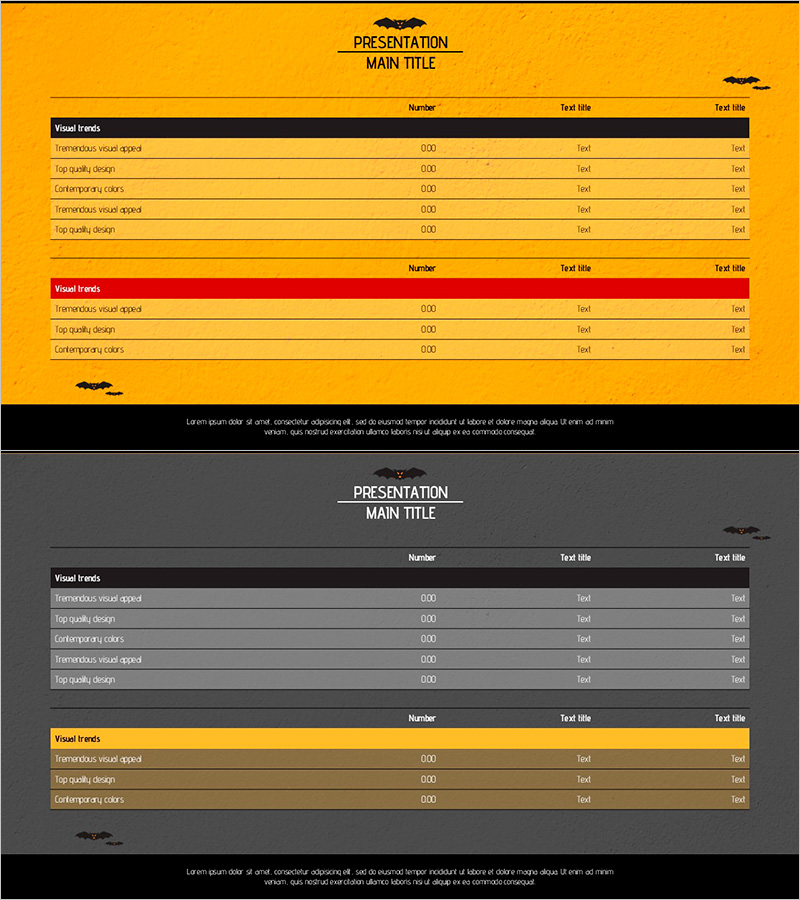
A horizontal table chart PowerPoint slide designed to organize and present business data with clarity and visual impact. The slide uses yellow and red accent colors to distinguish between two data sections, creating strong visual contrast for easy comparison. The 3-column structure (number, title, description) enables effective information organization and analytical presentation. Featuring 2 slide layouts optimized for 16:9 widescreen format, this template is ready for immediate editing in PPTX format. Perfect for business reports, performance analysis, comparative studies, and executive presentations where structured data visualization is essential.
Usage Points
-
Main Usage
Designed to present business metrics, performance indicators, and comparative data in a structured horizontal table format. Yellow and red color coding enables intuitive prioritization and category differentiation, while the 3-column layout (number, title, description) accommodates comprehensive information density for analytical presentations.
-
How to Use
Apply to report analysis sections, proposal comparison pages, meeting performance dashboards, and marketing plan channel performance reviews. Edit row text and numerical values to input actual data, add or remove rows as needed, and adjust colors to match your brand guidelines or presentation theme.
-
Recommended For
Data analysts, marketing managers, project managers, and business executives preparing performance reports and decision-support presentations. Ideal for monthly/quarterly/channel/departmental performance comparisons and cross-functional analysis presentations.
-
Slide Structure
2-slide layout with title area and 3-column table (number, title, description) on each slide. First slide features 5 yellow-highlighted rows; second slide features 3 red-highlighted rows, enabling clear categorical separation through color coding.
Related Products
-

Diagram Introducing Green Energy Business Site
#Business Introduction #Diagram #Technological Status
-

Diagram of Main Business Activities Areas – Visual Representation for Business Introduction
#Company Introduction #Business Introduction #Diagram
-

Navy Gray Organization Chart Diagram – Efficient Structure Representation
#Company Introduction #Diagram #Organizational Chart
-

Rainbow Presentation Template Chart and Icons – Enhance Your Financial Planning
#Financial Plans and Performance #Diagram #Capital Requirements
