Analyzing the Map of America – Key Values and Market Status
RJ0600038_10
- Last Update 07/01/2025
- File Size 0.4MB
- # of Slides 2
- File Format PPTX
- Slide Ratio 16:9
- Color
Keywords
About the Product
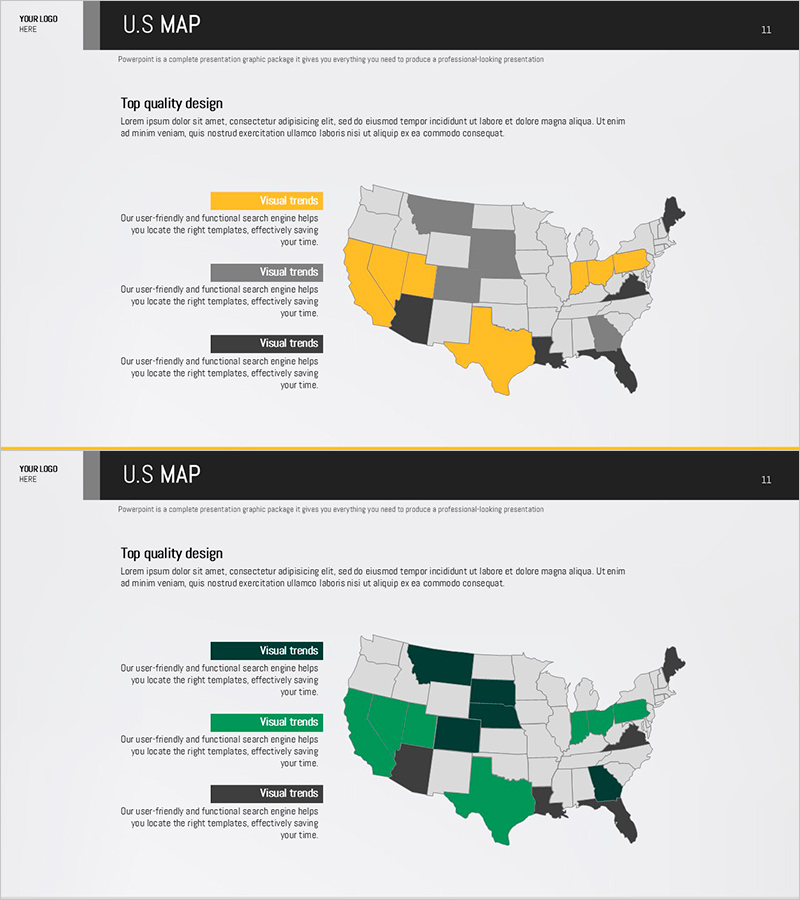
A U.S. map PowerPoint slide designed for regional data analysis and market visualization. The slide uses three color schemes (yellow, gray, and black in the first layout; green, dark green, and black in the second) to distinguish state-level data and trends. Each color is paired with a legend label and description text area, allowing you to highlight regional sales performance, customer distribution, market share, or geographic expansion. The two-slide set provides flexible color combinations to match your presentation context. Ideal for company overview, market analysis, and regional sales strategy presentations.
Usage Points
-
Main Usage
Visualize U.S. market data by region and communicate geographic insights to your audience. Use color coding to represent sales figures, customer density, market penetration, or regional performance metrics, enabling quick comprehension of location-based trends.
-
How to Use
Select and assign colors to each state based on your data categories. Customize the legend text to clarify what each color represents (revenue, customer count, market share, etc.). Add supporting text to highlight key regional characteristics and insights.
-
Recommended For
Ideal for sales, marketing, and executive presentations targeting U.S. market analysis. Particularly effective for global companies presenting regional strategy, market entry plans, or geographic sales performance to stakeholders and decision-makers.
-
Slide Structure
Two-slide set, each containing one U.S. map, three color-coded legend boxes, and three text description areas. First slide features yellow, gray, and black color scheme; second slide uses green, dark green, and black for alternative visual options.
Related Products
-

Market Analysis with Map Infographic Illustration – Strategies for Business Success
#Company Introduction #Market and Competitor Analysis #Other
-

Map of Domestic Networks and Partners in the U.S. – Orange, Green, Purple
#Company Introduction #Other #Customers and Partners
-

South Korea Target Area Infrastructure Map – Market and Competitor Analysis
#Company Introduction #Market and Competitor Analysis #Other
-

Aurora Analysis by US Region – Visualization for Insights
#Company Introduction #Market and Competitor Analysis #Other
