Up and Down Arrow Diagram – Effective Visual Communication
RJ0600036_13
- Last Update 06/30/2025
- File Size 0.3MB
- # of Slides 2
- File Format PPTX
- Slide Ratio 16:9
- Color
Keywords
About the Product
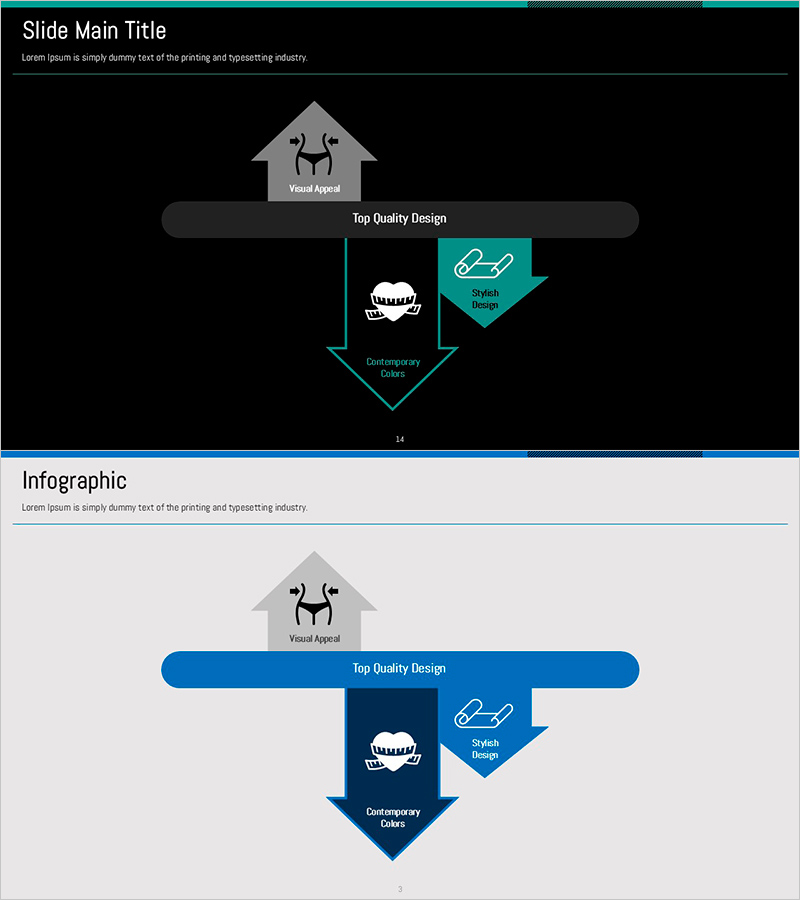
A vertical flow diagram PowerPoint slide featuring a 3-step downward process structure. The diagram begins with a gray arrow node at the top, flows through a dark gray horizontal bar in the center, and converges into a teal arrow box at the bottom, clearly representing sequential process progression. The black background with teal and white accent elements creates strong visual contrast and focus. Each stage includes space for icons, images, and text labels. Delivered as 2 slides in 16:9 PPTX format, fully editable and ready to use. Ideal for business presentations, project timelines, decision-making workflows, and operational procedures.
Usage Points
-
Main Usage
Effectively visualizes sequential process stages flowing from top to bottom. Perfect for illustrating decision-making workflows, project timelines, operational procedures, system architectures, and step-by-step methodologies. The downward arrow structure emphasizes causality and logical progression, enhancing audience comprehension.
-
How to Use
Enter the initial stage in the top gray arrow node, the intermediate stage in the center horizontal bar, and the final stage in the bottom teal arrow box. Add icons, images, or detailed text to each element to convey specific information. All colors and text are fully customizable to match your corporate branding and presentation theme.
-
Recommended For
Executives, project managers, consultants, training specialists, and marketing professionals presenting process improvements, system implementations, organizational restructuring, product launch schedules, and strategic initiatives. Particularly effective for strategy presentations, project kickoff meetings, and workflow optimization discussions.
-
Slide Structure
2-slide set with consistent 3-step vertical flow design. Slide 1 features a black background with gray top node, dark gray center bar, and teal bottom arrow box. Slide 2 presents the same structure on a light background in blue tones, providing flexibility for different presentation contexts and visual preferences.
Related Products
-

Connecting Diagram for Weight-Loss Program Course Enhancement
#Business Strategy #Business Management #Diagram
-

PowerPoint Template for Service Operation Strategy Presentation
#Business Management #Operational Plan #Technical Approach
-

Introduction to Core Competencies and Business Presentation Slide – Clarifying Business Vision and Strategy
#Business Introduction #Business Vision and Strategy #Diagram
-

Diagram Explaining Dangerous Drug Ingredients
#Company Introduction #Business Vision and Strategy #Diagram
