Eco-farming Agricultural Service Operation Plan Connection Diagram
RJ0600033_18
- Last Update 06/29/2025
- File Size 1.4MB
- # of Slides 2
- File Format PPTX
- Slide Ratio 16:9
- Color
Keywords
- #Content-Based Slides
- #Design-Based Slides
- #Technical Approach
- #Diagram
- #Service Operation Plan
- #Service Components
- #Cluster
- #Chain Diagram
- #16:9
- #connection diagram PowerPoint
- #4-step cluster slide
- #hexagon diagram template
- #process flow PPT
- #service operation plan diagram
- #how to create connection diagram in PowerPoint
About the Product
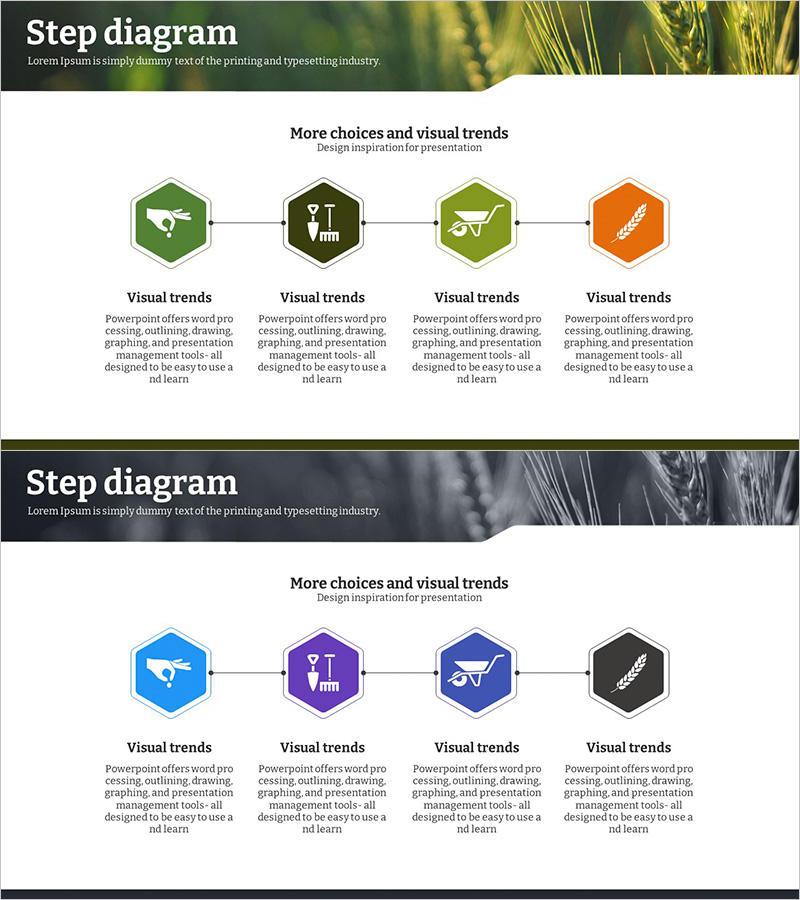
A connection diagram PowerPoint slide representing eco-farming agricultural service operation plans through four hexagonal nodes. Designed with green and orange accent colors, the slide uses linear connections to clearly visualize process flow and relationships between service components. The 2-slide set features adaptable backgrounds (nature imagery and neutral gray tones) suitable for technical presentations, service strategy explanations, and organizational structure discussions. Each node includes icon and text areas for immediate presentation use, with fully editable colors and node quantities to match your specific content requirements.
Usage Points
-
Main Usage
Communicate service operation processes, technical component structures, and inter-organizational relationships through four hexagonal nodes, enabling audiences to grasp sequential flow and interdependencies at a glance. Optimized for eco-farming services, business operations, and technology architecture explanations.
-
How to Use
Input service stage names, technical elements, or organizational titles into each hexagon node and replace icons to match your presentation context. Modify colors to emphasize priority levels or adjust the linear connection structure to highlight process progression.
-
Recommended For
Technology teams, service planning departments, and executive presentations. Ideal for business plans, proposals, operational strategy reports, and sessions explaining agricultural technology, environmental policy, or business processes.
-
Slide Structure
Two-slide set: Slide 1 features a golden grain background with four green and orange hexagon nodes connected linearly; Slide 2 uses a gray background with blue, purple, and black hexagon nodes in identical structure. Each node contains dedicated icon and text input areas.
Related Products
-

Diffusion Diagram for Overseas Travel – Innovative Service Composition
#Technical Approach #Diagram #Service Components
-

Preparation and Precautions for Water Play - Enjoying a Safe Summer
#Technical Approach #Risk Management and Regulatory Compliance #Diagram
-

Dot Patterns Wide PowerPoint Template – Diagram for Business Strategy
#Business Strategy #Technical Approach #Diagram
-

Business Process Circular Diagram – Effective Service Operations
#Operational Plan #Technical Approach #Diagram
