Key Point Analysis Chart – Operational Planning and Market Analysis
RL0100008_4
- Last Update 08/18/2025
- File Size 2.3MB
- # of Slides 2
- File Format PPTX
- Slide Ratio 4:3
- Color
Keywords
About the Product
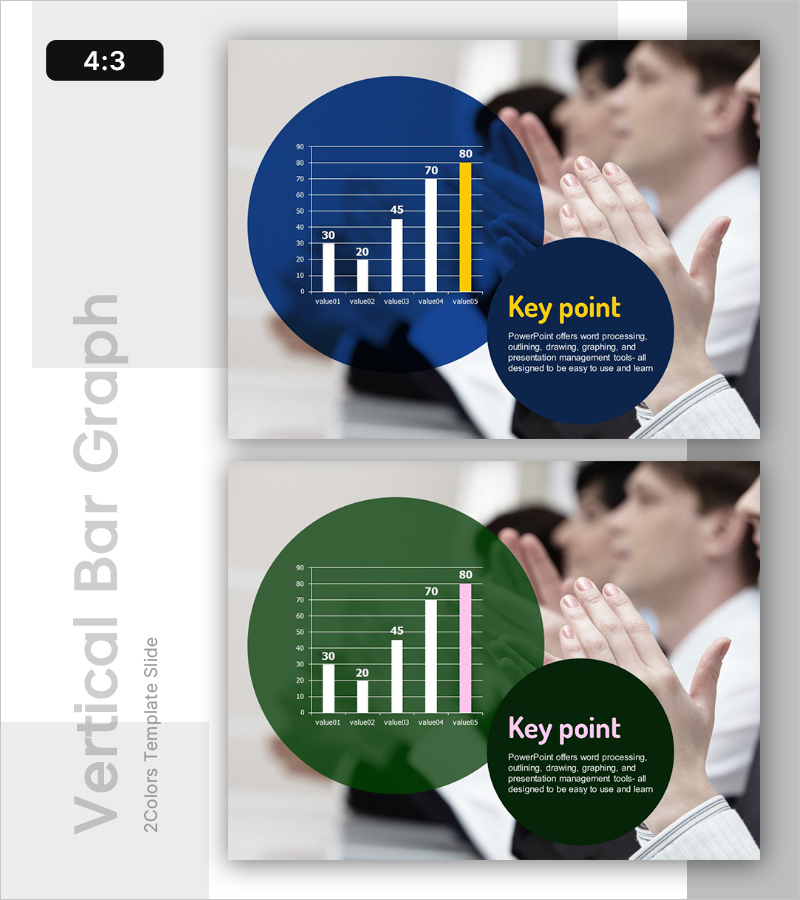
A professional key point analysis chart PowerPoint slide designed for operational planning and market analysis presentations. Available in two color schemes—dark blue and forest green—featuring a distinctive circular layout with embedded bar charts. The left circular area displays a horizontal bar graph with five data values (30, 20, 45, 70, 80) and gridlines for easy reading. The right circular area provides space for key message text with a yellow accent highlight. The background includes a semi-transparent business meeting image, adding credibility to your presentation. Ideal for communicating performance metrics, analytical findings, and operational insights in corporate settings.
Usage Points
-
Main Usage
This slide excels at presenting comparative data and highlighting critical insights from operational or market analysis. The five-item bar graph enables quick visual comparison of metrics, while the adjacent text area emphasizes the key takeaway or recommended action. Use it to support performance reviews, analytical discussions, and strategic decision-making in business presentations.
-
How to Use
Replace the sample data values (30, 20, 45, 70, 80) with your actual metrics in the bar chart. Enter your key insight or conclusion in the text area on the right. Select either the blue or green color variant to match your corporate branding. The yellow accent automatically highlights your most important message, drawing audience attention.
-
Recommended For
Executive briefings, quarterly performance reports, market research presentations, operational efficiency reviews, investor pitch decks, and strategic planning sessions. Particularly effective when you need to present quantitative data alongside qualitative interpretation. Suitable for finance, consulting, manufacturing, technology, and business services industries.
-
Slide Structure
Two-slide set with consistent layout. Each slide features a left circular area containing a five-item horizontal bar chart with gridlines, and a right circular area with 'Key point' heading and text input space for 2–3 lines of commentary. Semi-transparent business meeting background enhances professional appearance across both slides.
Related Products
-

Economic Consumption Template Intro
#Emotional Messages
-

Victory Factor Analysis Graph – Strengthening Market Competitiveness
#Emotional Messages
-

Competitive Sports Template Cover – Challenge and Achievement
#Emotional Messages
-

Winner Template Ending Cover – A Successful Conclusion
#Emotional Messages
