Business Icon Overlapping Diagram – Ideal for Strategy Development
RJ0600027_18
- Last Update 06/27/2025
- File Size 0.2MB
- # of Slides 2
- File Format PPTX
- Slide Ratio 16:9
- Color
Keywords
- #Content-Based Slides
- #Design-Based Slides
- #Business Vision and Strategy
- #Diagram
- #Business Strategy
- #Business Goals
- #Cluster
- #Combination Diagram
- #16:9
- #overlapping diagram PowerPoint
- #business icon slide template
- #three-circle Venn diagram
- #strategy presentation slide
- #intersection diagram download
- #business analysis PPT
About the Product
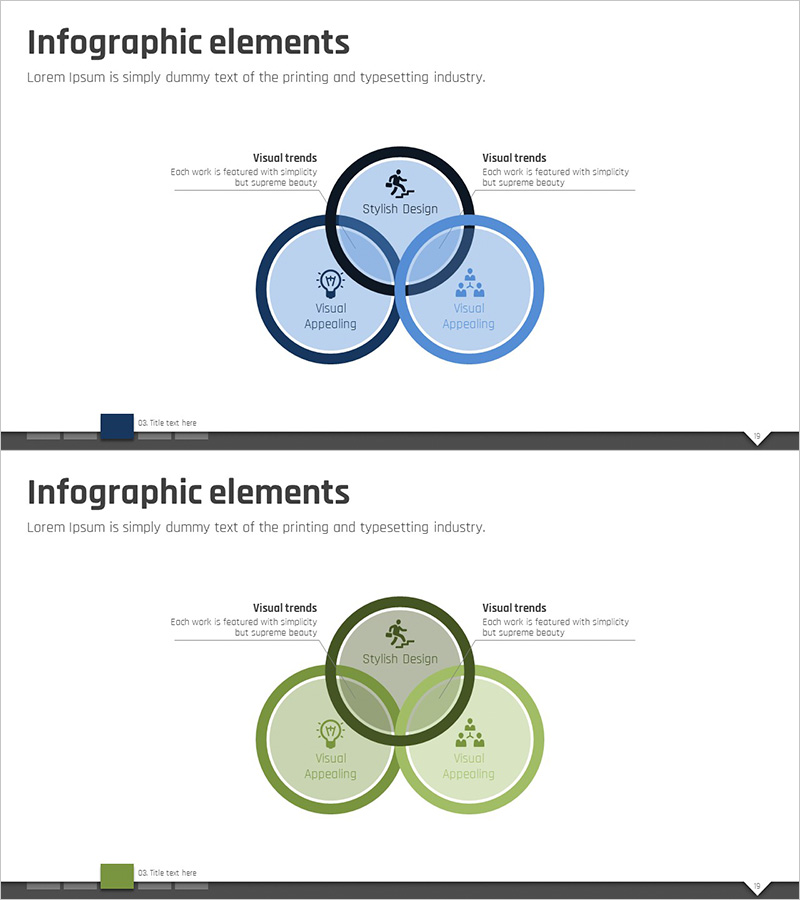
A three-circle overlapping diagram PowerPoint slide designed for strategic business analysis and goal mapping. Each circle contains a business icon (person, lightbulb, team) with dedicated text areas, while the central intersection zone visualizes the interaction of all three elements. The design uses dark blue and light blue gradient tones to create visual hierarchy and depth. Two slide variations are included—one in blue tones and one in green—allowing you to match your corporate brand guidelines. Ready to download and edit for presentations, strategy reports, and organizational planning documents.
Usage Points
-
Main Usage
Clearly express the relationships and intersections of three core strategic elements in business planning, goal analysis, and organizational capability mapping. Ideal for executive presentations, strategic planning meetings, organizational development seminars, and complex concept communication that requires visual simplicity and clarity.
-
How to Use
Enter strategic elements (e.g., technology, talent, capital) into each circle node, and place the integrated goal or outcome in the central intersection area. Icons and colors are fully editable to match your corporate identity. Highlight nodes sequentially during presentation to guide audience focus through your strategic narrative.
-
Recommended For
Executives, strategy managers, organizational development professionals, management consultants, and educators. Suitable for business strategy development, organizational capability assessment, marketing strategy planning, new business initiatives, team collaboration structure design, and any presentation requiring multi-layered relationship visualization.
-
Slide Structure
Three overlapping circular nodes (approximately 120px diameter each, 40% overlap ratio). Each node contains an icon (32×32px), title text, and description text area. Central intersection zone for integrated messaging. Slide 1: Blue palette (dark blue border, light blue fill). Slide 2: Green palette (dark green border, light green fill). 16:9 aspect ratio, PPTX format.
Related Products
-

The Differentiation Strategy of Interior Furniture – Business Goals and Vision
#Business Vision and Strategy #Diagram #Business Strategy
-

Goal Setting for Fat Reduction – Effective Business Strategy
#Business Vision and Strategy #Diagram #Business Strategy
-

Overlapping Diagrams to Clearly Convey Business Vision
#Business Vision and Strategy #Diagram #Business Strategy
-

Definition and Goals of Education – Sustainable Development
#Business Vision and Strategy #Diagram #Business Strategy
