Colored Pencil Highlight Diagram – Implementation of Business Strategy
RJ0500015_14
- Last Update 06/11/2025
- File Size 6.1MB
- # of Slides 2
- File Format PPTX
- Slide Ratio 16:9
- Color
Keywords
- #Content-Based Slides
- #Design-Based Slides
- #Business Vision and Strategy
- #Diagram
- #Business Strategy
- #Business Goals
- #Cluster
- #Combination Diagram
- #16:9
- #overlapping diagram PowerPoint
- #3-node diagram slide
- #business strategy presentation
- #colored pencil highlight PPT slide
- #diagram PowerPoint template
About the Product
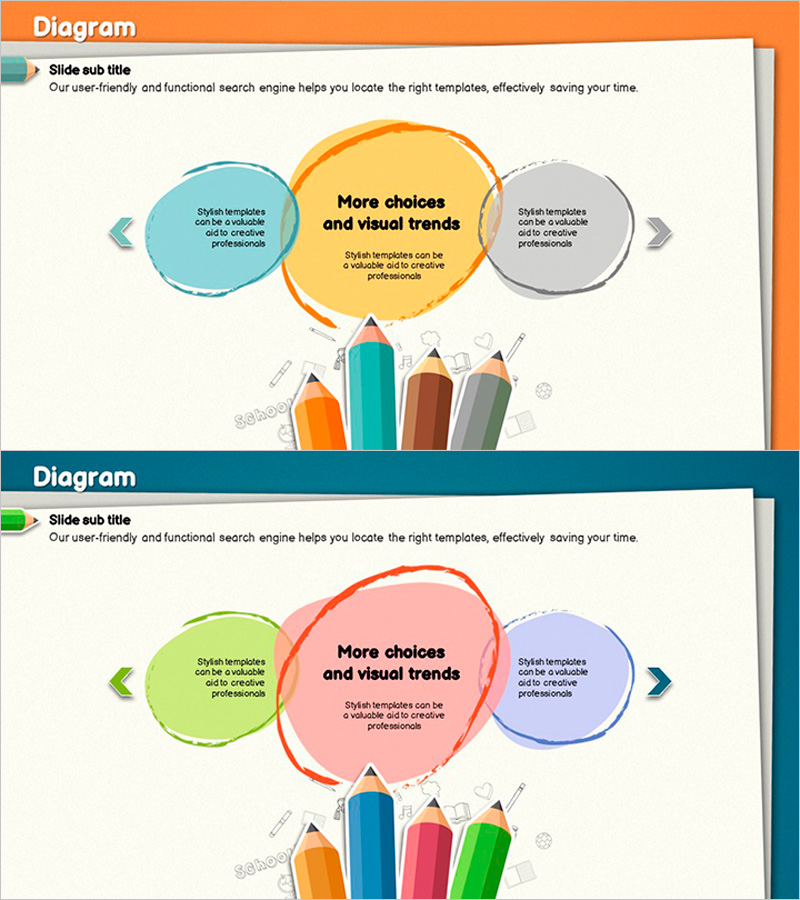
A 3-node overlapping diagram PowerPoint slide that visualizes business strategy implementation and goal achievement. Circular nodes in warm orange, teal, and gray colored pencil tones are arranged around a central highlight area, intuitively expressing the relationship between core messages and supporting strategic elements. The 2-slide set provides color variations (orange, pink, and purple palettes) for immediate use across different presentation contexts and brand identities. Connection arrows and text boxes clarify inter-node relationships, while bottom-aligned icons reinforce execution methods. This PowerPoint slide is ideal for diverse business presentations including business plans, strategy pitches, and organizational restructuring proposals.
Usage Points
-
Main Usage
Designed to clearly display the hierarchical relationship between core strategic elements and supporting execution strategies at a glance. The central highlighted node holds the core message, while left and right nodes contain detailed strategies, making the decision-making structure transparent and compelling.
-
How to Use
Use in executive briefings, strategy meetings, and business plan presentations to simultaneously explain organizational core objectives and three supporting strategic pillars. Customize each node's text to fit various contexts such as organizational structure, project phases, or market strategies.
-
Recommended For
Recommended for executives, business planners, marketing managers, and project managers presenting strategic planning and execution roadmaps visually. Particularly effective for investment pitches, business plans, and strategy presentations that emphasize core objectives and three execution axes.
-
Slide Structure
Central orange circular node (highlight area) + left teal node + right gray node in a 3-node overlapping configuration. Each node includes 2–3 text input areas, with 4 colored pencil-style icons positioned at the bottom to reinforce execution methods. Both slides maintain identical structure with color variations (orange, pink, and purple palettes).
Related Products
-

The Differentiation Strategy of Interior Furniture – Business Goals and Vision
#Business Vision and Strategy #Diagram #Business Strategy
-

Definition and Goals of Education – Sustainable Development
#Business Vision and Strategy #Diagram #Business Strategy
-

Marketing Strategy Overview - Clear Communication of Business Strategies
#Business Vision and Strategy #Diagram #Business Strategy
-

Business Goal Diagram for Energy Saving
#Business Vision and Strategy #Diagram #Business Strategy
