Strategy Analysis Graph – Business Vision and Market Analysis
RL0100006_3
- Last Update 11/02/2025
- File Size 1.4MB
- # of Slides 2
- File Format PPTX
- Slide Ratio 4:3
- Color
Keywords
About the Product
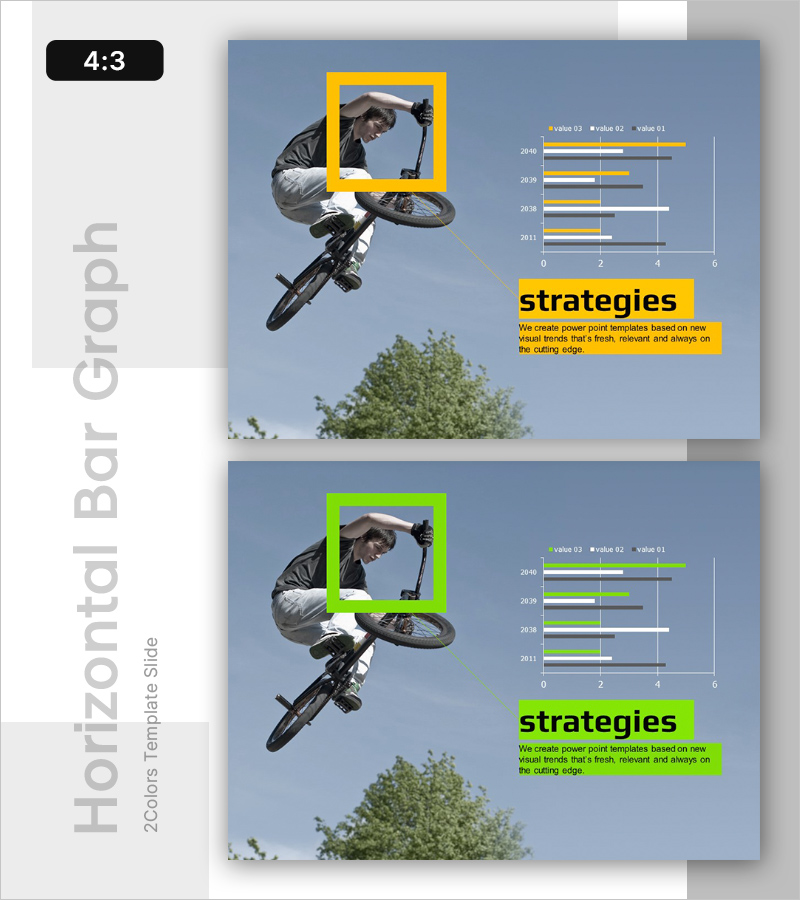
A strategy analysis graph PowerPoint slide designed for business vision and market analysis presentations. This slide features a horizontal bar chart in yellow and gray tones comparing three metrics across multiple years, with an image frame space on the left side for integrating business visuals. The 4:3 aspect ratio template includes two slide variations with color options (yellow and green), offering clearly separated data input areas and text description boxes for immediate editing and presentation use.
Usage Points
-
Main Usage
This slide visualizes business strategy and market conditions during strategic planning phases. The horizontal bar chart displays three metrics (value 01, 02, 03) across multiple years, enabling quick assessment of growth trends and goal achievement. The left image area accommodates brand, product, or team photos to reinforce strategic context and narrative.
-
How to Use
Deploy this slide in executive reports, investor presentations, and business plan pitches within the market analysis section. Replace chart values with actual data, insert relevant images in the left frame, and add strategic explanations in the right text box. Use the two-slide color variations to create contrast effects or represent sequential analyses.
-
Recommended For
Ideal for executives, strategy teams, marketing departments, and business development teams preparing business plans, quarterly reports, investor pitch decks, and market analysis reports. Particularly effective for new market entry presentations, market share analysis, and growth target communications.
-
Slide Structure
The slide divides into left image frame (yellow or green border) and right information area. The right section contains a horizontal bar chart comparing three metrics across years (2040, 2039, 2038, 2011) with a yellow text box below for strategy descriptions. Total editable elements: 2 text input areas and 12 data cells (4 years × 3 metrics).
Related Products
-

Children's Abilities Intro Slide – Creativity and Confidence
#Emotional Messages
-

Cluster Slide for Company Overview - See the Possibilities
#Emotional Messages
-

Growth and Development – Effective Business Strategy Introduction
#Emotional Messages
-

Market Analysis with Donut Graph – The Power of Data Visualization
#Emotional Messages
