Economic Growth Analysis Graph – Market and Competitor Analysis
RL0100004_3
- Last Update 01/18/2025
- File Size 1.1MB
- # of Slides 2
- File Format PPTX
- Slide Ratio 4:3
- Color
Keywords
About the Product
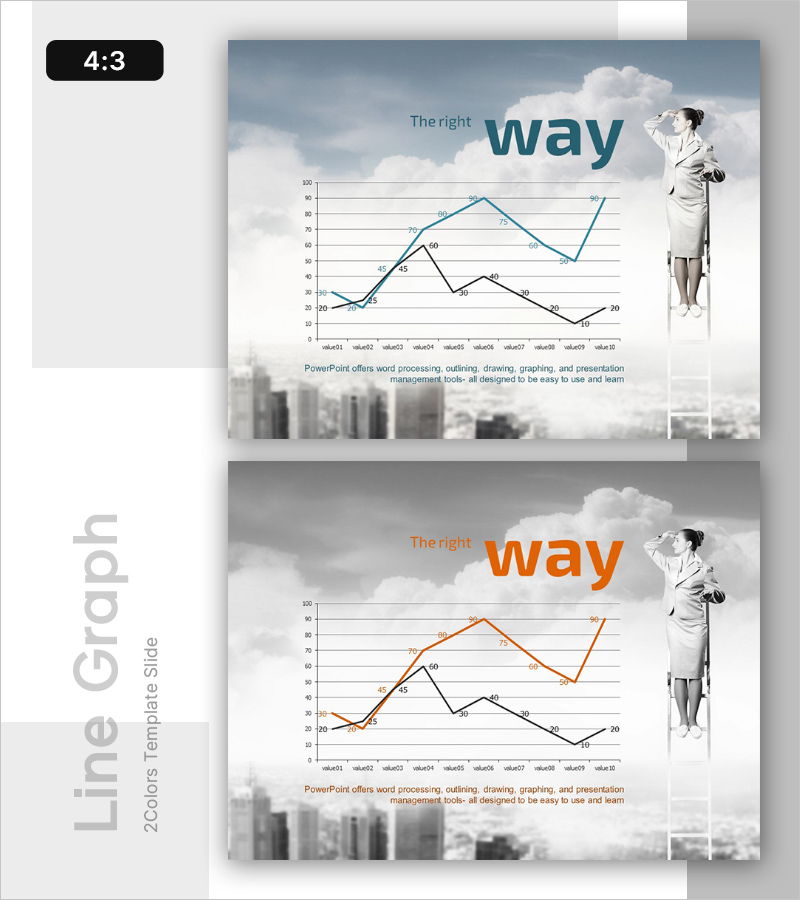
A PowerPoint slide designed for market and competitor analysis featuring an economic growth analysis graph. This presentation slide visualizes two data series using a line chart that tracks quarterly trends across ten periods. The design combines a professional sky-blue background with business imagery and contrasting blue and black data lines to enhance presentation credibility. Provided in fully editable PPTX format, this slide is ideal for market trend analysis, competitive performance comparison, business growth reporting, and strategic planning presentations.
Usage Points
-
Main Usage
This slide enables simultaneous comparison of market trends and competitive performance using a two-series line chart. It displays economic growth rates or revenue trends across ten quarters, allowing stakeholders to quickly identify relative positions and growth patterns. Perfect for investor presentations, executive briefings, and market analysis meetings requiring data-driven decision support.
-
How to Use
Replace the chart data with your actual figures by editing the data table in PowerPoint. Customize the legend and axis labels to clearly identify your comparison subjects (e.g., your company vs. competitors, current year vs. previous year). The sky background and businesswoman illustration can be retained or customized with your company logo and brand colors.
-
Recommended For
Ideal for executives, finance teams, marketing departments, and business development teams presenting market analysis results. Use in quarterly performance reports, competitive benchmarking analysis, business growth strategy meetings, and investor relations presentations. Suitable for any business presentation requiring two-metric trend comparison.
-
Slide Structure
Two-slide set with identical line chart layouts. Each slide features a title area with 'Economic Growth Analysis' text and business imagery at the top, a dual-series line chart displaying ten quarterly data points in the center, and descriptive text space at the bottom. Formatted in 4:3 aspect ratio for optimal display on standard projectors and monitors.
Related Products
-

Research Status Analysis Graph – Insights on Market and Competitors
#Emotional Messages
-

AI Innovation Business Ideas Slide – Creative Visualization
#Emotional Messages
-

Opportunities for Advancement in Life – Vision and Strategy for Success
#Emotional Messages
-

Future Vision Diagram – Visualizing Business Strategy and Vision
#Emotional Messages
