Environmental Protection Pie Diagram – Towards a Sustainable Future
RJ0600015_15
- Last Update 06/24/2025
- File Size 2.7MB
- # of Slides 2
- File Format PPTX
- Slide Ratio 16:9
- Color
Keywords
- #Content-Based Slides
- #Design-Based Slides
- #Product/Service Introduction
- #Diagram
- #Differentiation Strategy for Products/Services
- #Spread
- #Decentralized Diagram
- #16:9
- #pie chart PowerPoint slide
- #4-section circular diagram
- #environmental protection presentation
- #ratio visualization slide
- #pie chart template download
About the Product
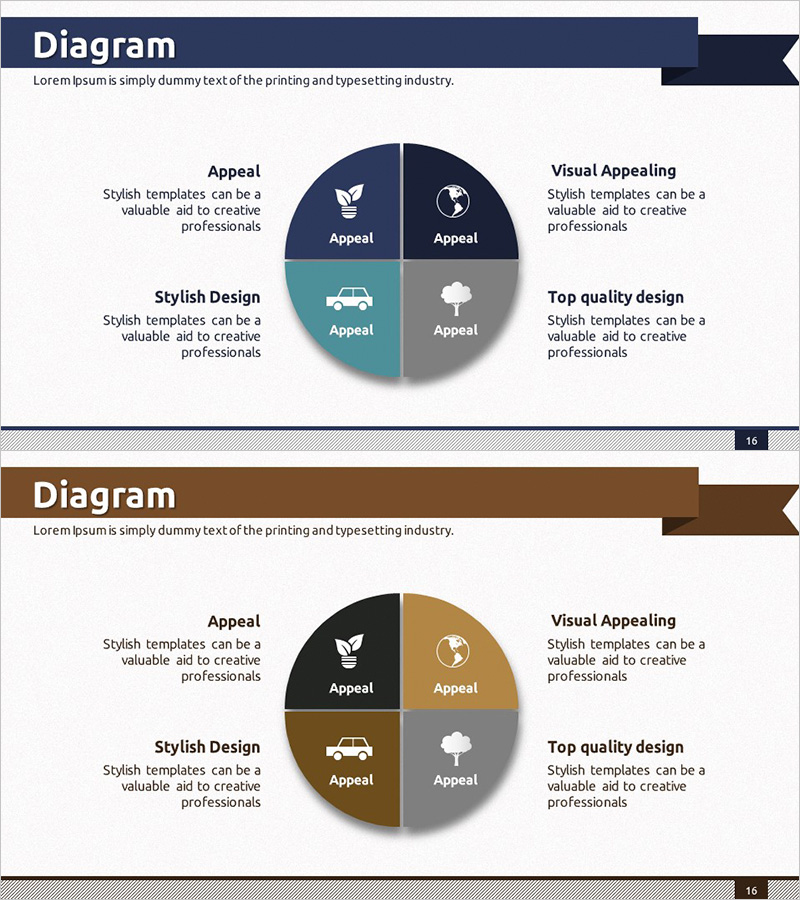
A 4-section pie chart PowerPoint slide designed for environmental protection and sustainability topics. The chart divides into four segments in navy blue, khaki, gray, and teal, each labeled with an icon (leaf, globe, car, cloud) and descriptive text. Explanation boxes surround each section to present both proportional comparison and conceptual information simultaneously. The 2-slide set offers multiple color combinations in 16:9 widescreen format, optimized for modern presentation environments. Ready to use immediately for environmental policy presentations, sustainability reports, corporate social responsibility disclosures, and strategic communications.
Usage Points
-
Main Usage
Visualizes proportional, compositional, or segmented data using a circular pie chart format. Effectively communicates four distinct themes such as environmental protection, sustainability pillars, corporate responsibility areas, or organizational divisions. Suitable for presenting marketing frameworks, business strategy pillars, departmental structures, or any concept requiring balanced four-way division.
-
How to Use
Edit section text and icons to match your specific topic. Customize the descriptive text boxes surrounding each segment with relevant content, and adjust colors as needed to emphasize importance or create visual hierarchy. Compare the two color versions provided and select the combination that best fits your presentation context.
-
Recommended For
Environmental and energy professionals, sustainability report authors, policy makers, marketing strategists, executives presenting organizational structure or strategic frameworks, educators and seminar facilitators explaining four-element concepts and their interrelationships. Ideal for stakeholder communications and strategic planning presentations.
-
Slide Structure
Central circular pie chart divided into 4 equal segments, each with distinct color, icon, and label. Descriptive text boxes positioned around the chart (top-left, top-right, bottom-left, bottom-right) clarify the meaning of each segment. Two-slide set provides navy-khaki and navy-gray-teal color variations for flexible design options.
Related Products
-

Three Expected Effects from Eco-friendly Business Leaf Diagram
#Product/Service Introduction #Operational Plan #Diagram
-

Circular Diagram for Introduction and Characteristics – Emphasizing Business Impact
#Product/Service Introduction #Business Vision and Strategy #Operational Plan
-

Emphasizing Social Responsibility through Environmental Diffusion Diagram
#Product/Service Introduction #Corporate Social Responsibility #Diagram
-

Business Diagram Template with Color Theme
#Product/Service Introduction #Business Vision and Strategy #Diagram
