Pie Chart for Market Share Analysis – Capturing Happiness
RL0100001_3
- Last Update 01/18/2025
- File Size 3.9MB
- # of Slides 2
- File Format PPTX
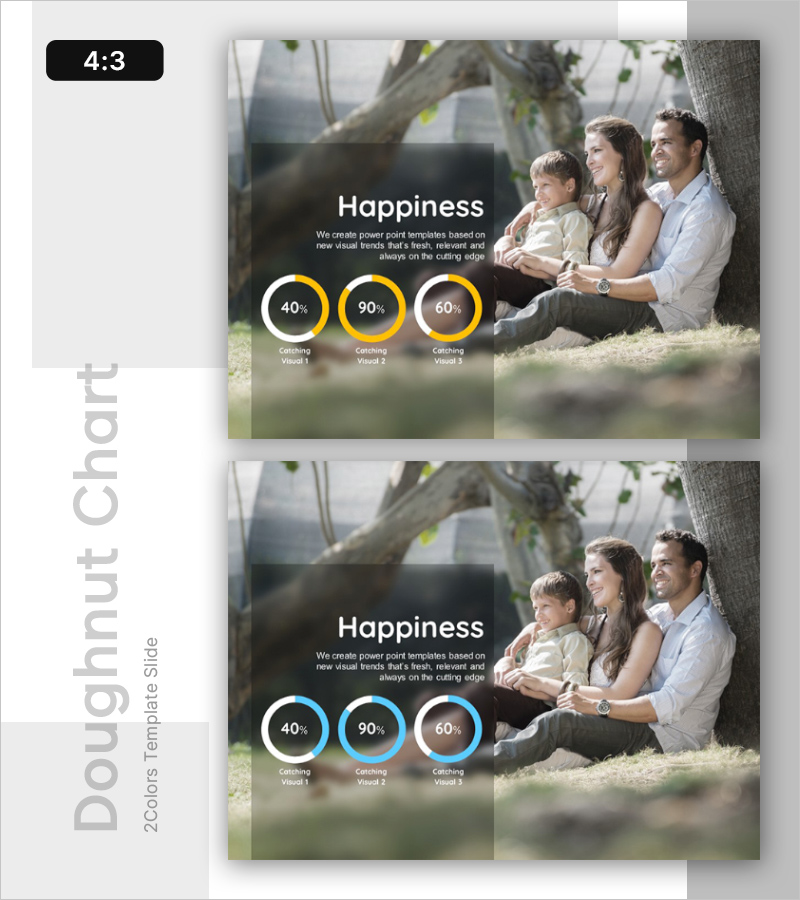
- Slide Ratio 4:3
- Color
Keywords
About the Product
A PowerPoint slide featuring pie charts for market share and data comparison analysis. Three circular charts with white borders display 40%, 90%, and 60% data highlighted in yellow tones, layered over a semi-transparent dark overlay with a family image background. Provided in 4:3 aspect ratio with 2 slides, featuring clearly separated text and chart areas for immediate editing. Ideal for business presentations, marketing reports, and market research presentations.
Usage Points
-
Main Usage
Optimized for visualizing market share, sales distribution, and customer segments as proportions of a whole. Enables simultaneous comparison of three data categories, with yellow accent color directing focus to key metrics and percentages.
-
How to Use
Use in marketing plans, market analysis reports, and sales presentations within market overview and competitive analysis sections. Edit chart percentages and labels with actual data, and customize background images to match your brand identity and presentation theme.
-
Recommended For
Marketing managers, sales directors, market analysts, and executives presenting market conditions and competitive positioning. Suitable for B2B sales pitches, investor presentations, and quarterly performance reports.
-
Slide Structure
2-slide set with title and description text areas separated from three pie chart visualization areas. Each slide contains 2 text input fields (title and description) and 3 editable pie charts, with distinct background image and data visualization zones for flexible customization.


