Visually Presenting Global Markets – Strategic Comments
RJ0600012_12
- Last Update 06/23/2025
- File Size 0.6MB
- # of Slides 2
- File Format PPTX
- Slide Ratio 16:9
- Color
Keywords
About the Product
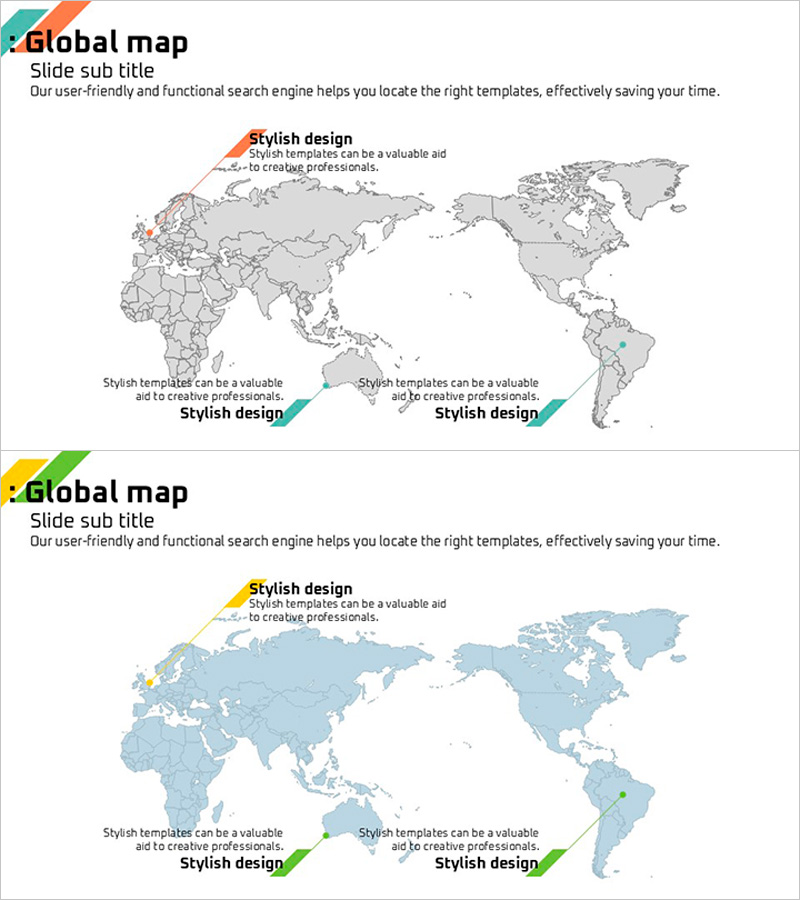
A 2-slide PowerPoint presentation that visualizes global market conditions and regional strategies at a glance. The gray-background world map features three color-coded point markers (orange, green, teal) highlighting key regions, with dedicated text input areas for each zone. The first slide uses a line-style map while the second employs a filled-color map, allowing you to choose the information delivery style that best suits your presentation. Instantly applicable for international business presentations, market analysis reports, and global network introductions.
Usage Points
-
Main Usage
Visualizes global market conditions, regional business strategies, and international partnership status through map-based graphics to support decision-making. Ideal for investor presentations, executive briefings, and market analysis sessions where regional positioning must be communicated clearly.
-
How to Use
Enter country or region names at each marker point and describe the corresponding region's strategy, performance, or objectives in the text boxes below. Use the line map for clean analytical presentations and the filled-color map when visual emphasis is needed. Color modifications enable category-based differentiation.
-
Recommended For
International business managers, marketing strategy teams, investor relations professionals, and global sales teams explaining market conditions, competitive analysis, and expansion strategies. Suitable for consulting firms, trading companies, and multinational corporations preparing executive reports.
-
Slide Structure
Two-slide layout: First slide features a line-style world map with three point markers and three text input areas (top-left, center, bottom-right); second slide mirrors this structure on a filled-color map. Both slides include title and subtitle sections for clear information hierarchy.
Related Products
-

World Map with Regional Markings – Securing Global Networks
#Company Introduction #Other #Global Network
-

Global Target Market Map – Visual Insights for Market Analysis
#Company Introduction #Market and Competitor Analysis #Other
-

Global Map Highlighting Each Continent – Insights into Global Network
#Company Introduction #Other #Global Network
-

Highlighted Circular Global Map – Effective Market Analysis
#Company Introduction #Market and Competitor Analysis #Other
