Visualization of Financial Plan through System Diagram – Blue Green Design
RJ0600009_15
- Last Update 06/23/2025
- File Size 4.9MB
- # of Slides 2
- File Format PPTX
- Slide Ratio 16:9
- Color
Keywords
- #Content-Based Slides
- #Design-Based Slides
- #Product/Service Introduction
- #Diagram
- #Product/Service Introduction
- #Benefits and Advantages
- #Cluster
- #Spread
- #Decentralized Diagram
- #16:9
- #cluster diagram PowerPoint
- #4-cell diagram slide
- #system structure visualization
- #financial plan PowerPoint
- #diagram slide template
About the Product
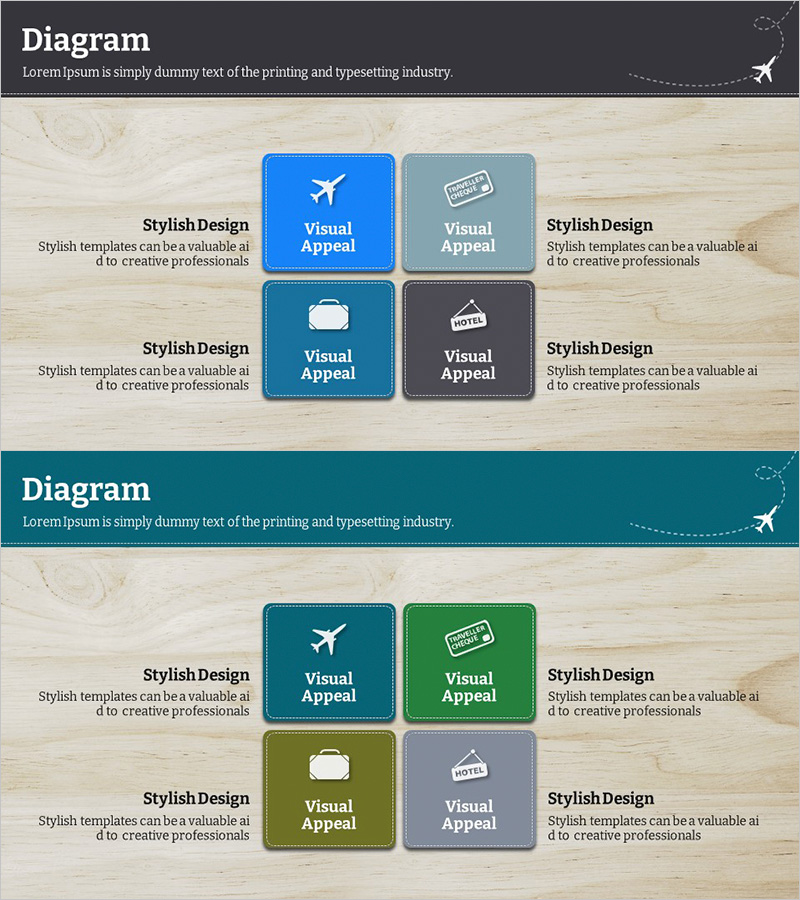
A 4-cell cluster diagram PowerPoint slide for visualizing financial plans and system structures. Featuring a wood-grain background with four rounded-square cells in blue, green, gray, and dark tones, each containing an icon (airplane, stamp, briefcase, hotel) and text area. The 2-slide set includes color variations (blue emphasis and green emphasis) for flexible presentation contexts. Ideal for financial analysis, strategic planning, departmental role allocation, and project component classification in business presentations.
Usage Points
-
Main Usage
Visualizes financial plans, system structures, strategic elements, and departmental roles across four distinct categories. Each cell's icon and text area clearly communicate key information, enhancing audience comprehension and engagement.
-
How to Use
Enter department names, roles, objectives, or strategies into each cell's text area to represent organizational structures or project components. Use the blue-emphasis slide to convey trust and stability; use the green-emphasis slide to emphasize growth and positivity.
-
Recommended For
Recommended for finance teams, strategy departments, project managers, and executive presentations. Effective for business plan pitches, quarterly performance reports, organizational restructuring explanations, and new project kickoff meetings.
-
Slide Structure
2-slide set. Each slide features a wood-grain background with a 2×2 grid layout of four rounded-square cells. Cell colors are differentiated in blue, green, gray, and dark tones, with each cell containing an icon and 'Visual Appeal' text area for customization.
Related Products
-

Home Appliances Essentials and Text Boxes – Modern Design and Style
#Product/Service Introduction #Diagram #Product/Service Introduction
-

Dot Patterns Wide Presentation Template – Cluster Diagram
#Product/Service Introduction #Diagram #Product/Service Introduction
-

Fruit Vegetable Connection Diagram – Freshness and Effective Communication
#Product/Service Introduction #Diagram #Product/Service Introduction
-

How to Enjoy Leisure Time While Traveling – Modern Design Relaxation
#Product/Service Introduction #Diagram #Text Box
