Visualizing Business Schedule with Blue Green Line Graph Slide
RJ0600009_11
- Last Update 06/23/2025
- File Size 5.2MB
- # of Slides 2
- File Format PPTX
- Slide Ratio 16:9
- Color
Keywords
- #Content-Based Slides
- #Design-Based Slides
- #Operational Plan
- #Diagram
- #Project Implementation Schedule
- #Table
- #Standard Table
- #16:9
- #Gantt chart PowerPoint
- #business schedule slide template
- #project timeline PowerPoint
- #horizontal bar chart slide
- #weekly schedule template
- #task management presentation
About the Product
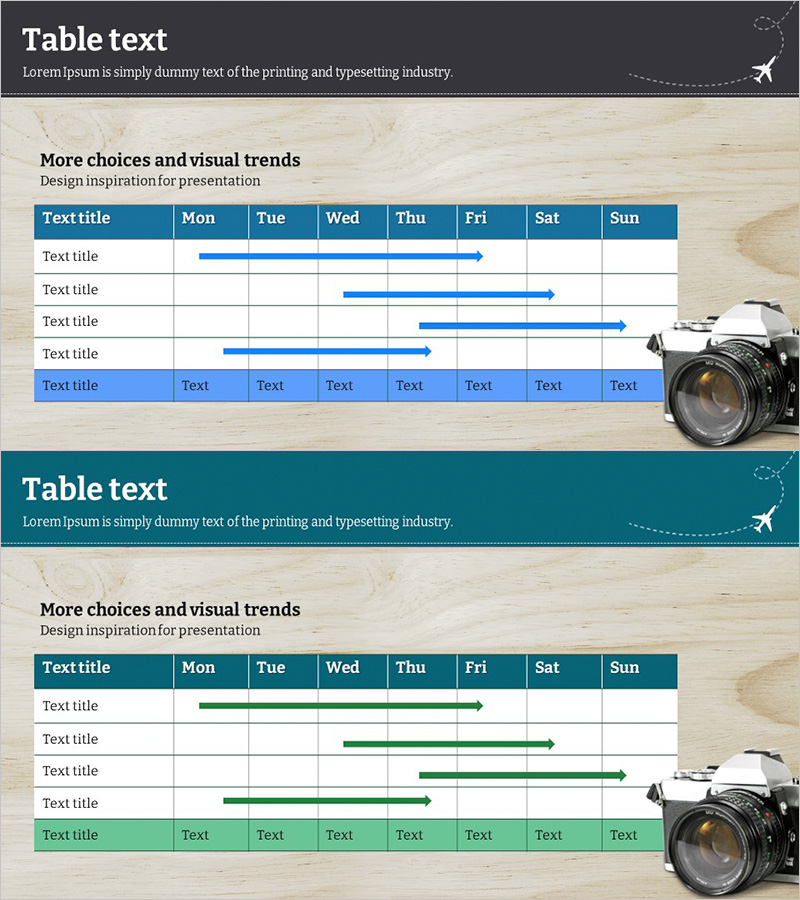
A 2-slide PowerPoint template set for visualizing business schedules and project timelines. The horizontal bar chart uses blue and green tones to clearly display weekly schedules across Monday through Sunday, making it ideal for monthly and weekly project management. Each row includes a text input area for task names and duration, with a blue header row that emphasizes information hierarchy. This presentation slide template is ready to use for operational plans, marketing campaign schedules, product development roadmaps, and executive progress reports.
Usage Points
-
Main Usage
Visualize project schedules, operational plans, and marketing campaign timelines on a weekly and monthly basis so teams can understand progress at a glance. The blue-green horizontal bars clearly represent each task duration, making it ideal for executive reports, project kickoff meetings, and strategic presentations.
-
How to Use
Enter task names in the text input area of each row and drag the bar length to adjust the actual schedule period. The header row (Mon–Sun) is fixed for weekly units and can be color-customized to distinguish priorities or departments. Optimized for 16:9 widescreen displays, it works well for large monitor presentations and projector displays.
-
Recommended For
Recommended for project managers, operations teams, marketing teams, and product development teams who need schedule management. Suitable for quarterly business plan presentations, new product launch schedules, organizational restructuring roadmaps, and marketing campaign schedule sharing.
-
Slide Structure
Slide 1: Header (Mon–Sun day labels with blue background) + 5 rows (each with text input area and blue-green horizontal bar). Slide 2: Alternative layout with green tone emphasis. Each bar is independently adjustable in length, using pure timeline representation without connecting lines between nodes.
Related Products
-

Simple & Modern Wide PPT – Perfect Choice for Business Management and Operations Planning
#Business Management #Operational Plan #Diagram
-

Modern Wide PowerPoint Schedule – Visualization of Business Plans
#Business Management #Operational Plan #Diagram
-

Interior Work Schedule – Business Strategy Presentation Template
#Business Strategy #Operational Plan #Diagram
-

AI Implementation Roadmap PowerPoint Slide – 12-Week Matrix
#Business Strategy #Business Management #Operational Plan
