The Efficacy of Coffee – Visual Information Diagram
RJ0600003_9
- Last Update 06/22/2025
- File Size 5.3MB
- # of Slides 2
- File Format PPTX
- Slide Ratio 16:9
- Color
Keywords
About the Product
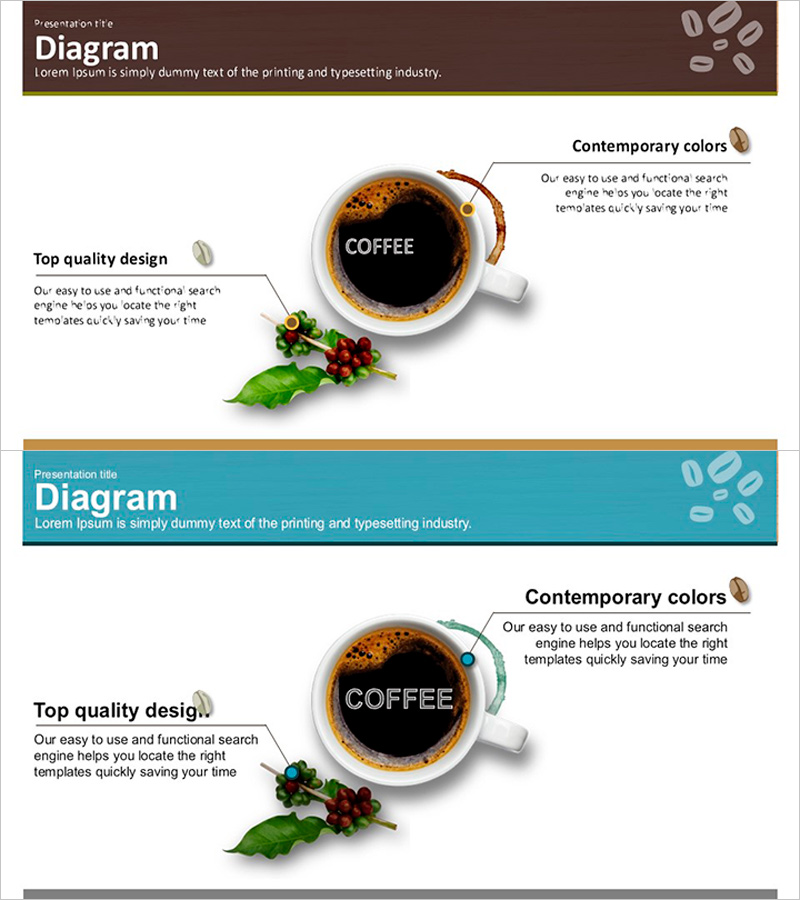
A radial connection diagram PowerPoint slide set that visually communicates coffee benefits and product features. The design centers on a coffee cup image with text boxes and icons connected on both sides, enabling audiences to grasp key information at a glance. The contrasting color palette of brown and teal creates strong visual emphasis, while the blend of product photography and graphic elements conveys a premium aesthetic. This 2-slide presentation template is ready to use for product introductions, marketing pitches, brand storytelling, and business presentations across industries.
Usage Points
-
Main Usage
Presents product benefits and features arranged around a central image, creating a hierarchical information flow from core message to supporting details. The radial structure naturally guides audience attention and enhances information retention through visual organization.
-
How to Use
Replace the center coffee image with your product photo or logo, then populate the surrounding text boxes with key benefits, features, or usage instructions. Colors and icons are fully editable to match your brand guidelines. Use both slides sequentially to expand information depth or present different product angles.
-
Recommended For
Product marketing teams, sales professionals, and brand managers presenting product efficacy and value propositions. Ideal for beverage, food, health supplement, and consumer goods industries, as well as technology and service companies seeking to visualize core product value.
-
Slide Structure
Two-slide set with radial layout: central product image (coffee cup), four surrounding text boxes (two left, two right) connected by arrows and lines. Header section contains presentation title; brown background with teal accent elements establish visual hierarchy and professional appearance.
Related Products
-

Step-by-step Business Objectives Diagram – Execution Roadmap for Vision Realization
#Product/Service Introduction #Business Vision and Strategy #Diagram
-

Science Experiment Characteristics Diagram – Business Area Overview
#Product/Service Introduction #Business Introduction #Diagram
-

Strategic Saving & Asset Diversification Plan Slide Template
#Product/Service Introduction #Financial Plans and Performance #Diagram
-

Pill Shape Connection Diagram – Product and Service Overview
#Product/Service Introduction #Diagram #Features
