Illustrations and Components of Coffee Cups - Premium Infographic
RJ0600003_19
- Last Update 06/21/2025
- File Size 4.4MB
- # of Slides 2
- File Format PPTX
- Slide Ratio 16:9
- Color
Keywords
About the Product
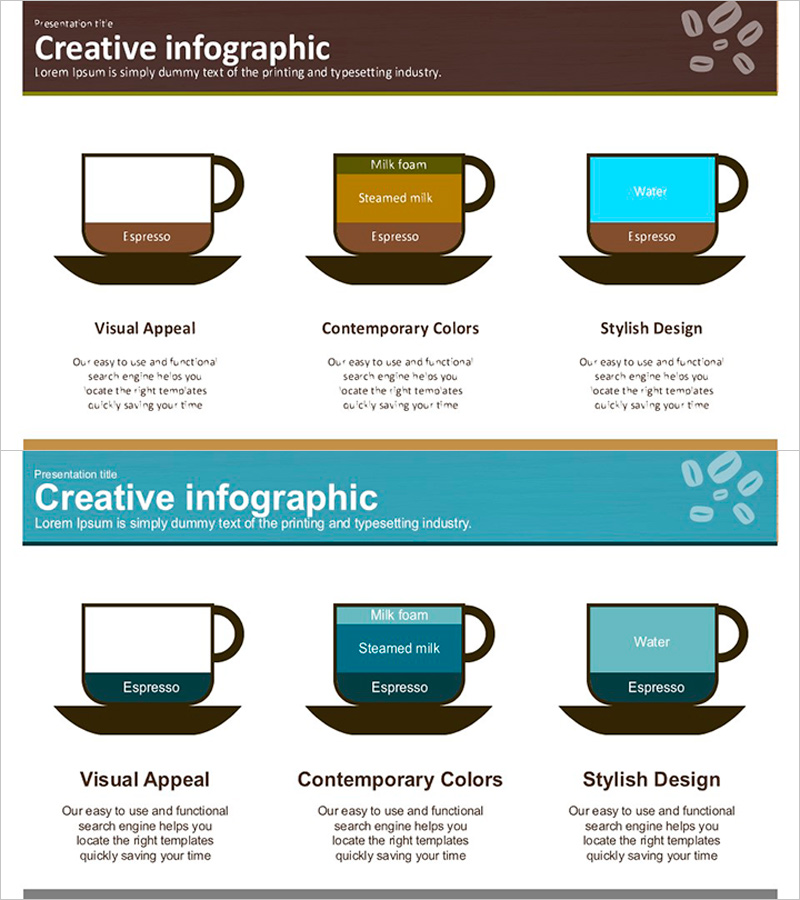
A PowerPoint slide that visualizes coffee cup components in a 3-layer hierarchical structure. Each ingredient—espresso, steamed milk, and water—is represented as individual illustrations, with a harmonious color palette of brown, olive, and cyan tones that conveys café aesthetics. The 2-slide set presents the same concept from multiple visual perspectives, making it instantly applicable for product introductions, beverage explanations, and process decomposition presentations.
Usage Points
-
Main Usage
An infographic slide that hierarchically decomposes and explains product or beverage components. By representing each ingredient as an independent illustration while maintaining overall structural clarity, it effectively enhances audience understanding in café, beverage, and food-related presentations.
-
How to Use
Use in product introduction slides when explaining ingredient composition, or decompose beverage and food manufacturing processes step-by-step. Apply in marketing presentations, sales pitches, and educational materials to intuitively visualize complex structures and ingredient relationships.
-
Recommended For
Café and beverage brand managers, food company marketing teams, product planning and development staff, sales and customer explanation professionals, educators and seminar instructors who need to explain component structures in presentations.
-
Slide Structure
2-slide set with each slide centered on a coffee cup illustration and three ingredients (espresso, steamed milk, water) displayed individually at the top in a layer structure. Brown background with olive and cyan accent colors create visual hierarchy, with clearly separated text and illustration areas for easy customization.
Related Products
-

Creative Coffee Infographics – Product and Service Introduction
#Product/Service Introduction #Diagram #Features
-

Natural Environment Icon and Pyramid Structure Slide
#Product/Service Introduction #Diagram #Features
-

Mobile Service 3D Diagram – Effectively Presenting Technical Attributes
#Product/Service Introduction #Technical Approach #Diagram
-

Arctic Business Company Internal Organization Chart – Structure and Efficiency
#Product/Service Introduction #Marketing Plan and Strategy #Diagram
