Blue Yellow Diagram for Study Plan Visualization
RJ0500043_29
- Last Update 06/19/2025
- File Size 0.4MB
- # of Slides 2
- File Format PPTX
- Slide Ratio 16:9
- Color
Keywords
About the Product
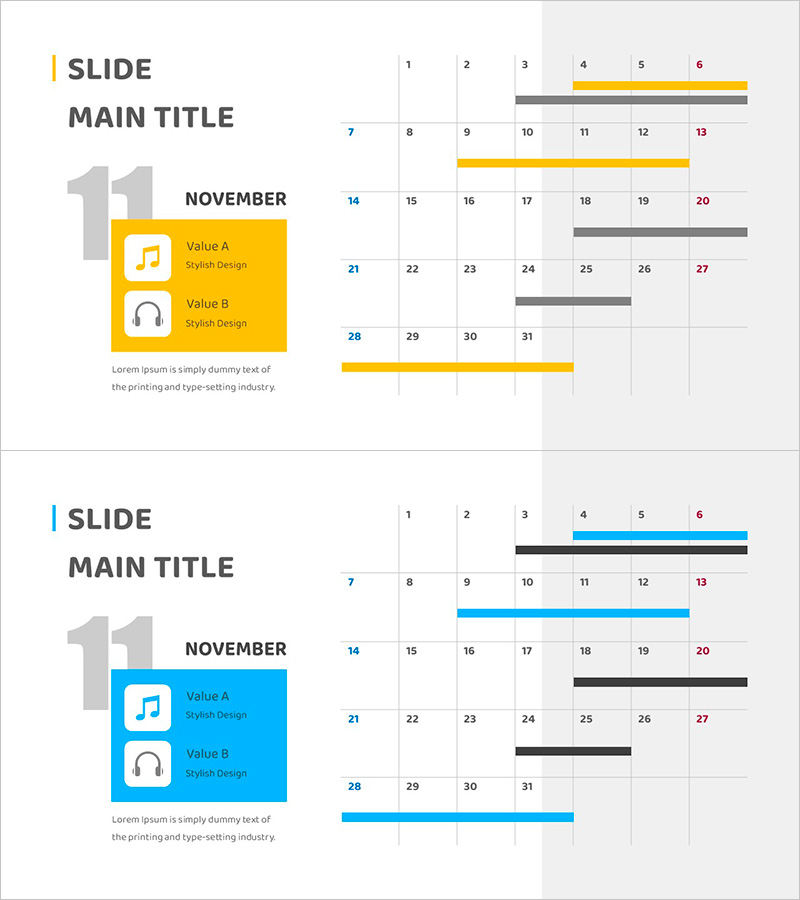
A Gantt chart diagram PowerPoint slide for visualizing learning schedules and project timelines. This presentation template uses blue and yellow horizontal bars to distinguish multiple learning items, making it easy to see duration and overlaps at a glance. The 2-slide set is ready to use for educational project presentations, learning roadmap discussions, and schedule management meetings. Fully editable PPT format for immediate customization.
Usage Points
-
Main Usage
Visualize learning schedules, project timelines, and educational roadmaps using a time-axis-based diagram. Horizontal bars represent start dates, end dates, and duration of multiple learning items, enabling intuitive communication of overall schedule structure.
-
How to Use
Ideal for semester planning presentations at educational institutions, online course curriculum explanations, personal study plan presentations, and team project schedule meetings. Customize bar lengths and positions to match your actual timeline and requirements.
-
Recommended For
Education coordinators, project managers, learning specialists, students, academic administrators, and training professionals who need to communicate learning plans and schedules effectively.
-
Slide Structure
2-slide set featuring horizontal Gantt chart bars in blue and yellow. Each slide includes month labels and item names on the left, date grids and colored progress bars on the right, plus additional text areas for descriptions and notes.
Related Products
-

Cluster Diagram for Business Goal Setting – Systematic Business Strategy
#Business Vision and Strategy #Marketing Plan and Strategy #Diagram
-

Clothing Service Marketing Goals – Modern Design
#Business Vision and Strategy #Marketing Plan and Strategy #Diagram
-

Detailed Plan Schedule – Roadmap for Business Strategies
#Business Strategy #Business Management #Operational Plan
-

Seminar Kick-off Guide - Welcome Page
#Slide Type #Company Introduction #Diagram
