Two-country Comparison Chart - Market Analysis and Global Business
RJ0500027_25
- Last Update 06/14/2025
- File Size 1.4MB
- # of Slides 2
- File Format PPTX
- Slide Ratio 16:9
- Color
Keywords
- #Content-Based Slides
- #Design-Based Slides
- #Company Introduction
- #Product/Service Introduction
- #Market and Competitor Analysis
- #Diagram
- #Other
- #Global Network
- #Market Analysis
- #Table
- #16:9
- #world map comparison chart PowerPoint
- #two-country data visualization slide
- #global business presentation template
- #market analysis chart PPT
- #how to compare countries in PowerPoint
About the Product
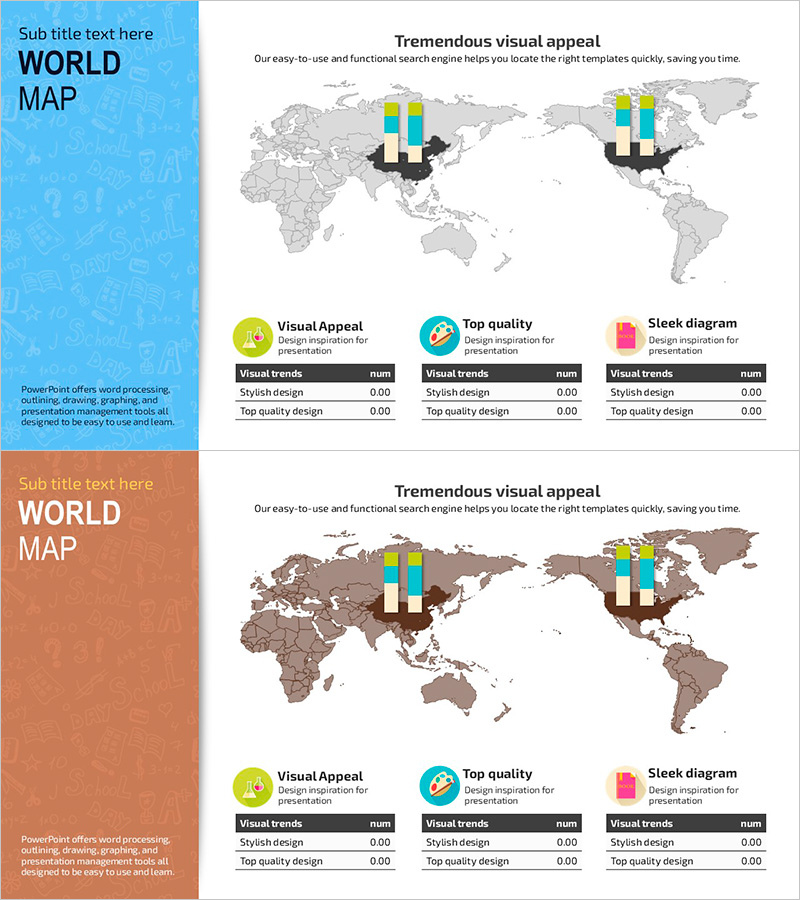
A professional two-country comparison chart PowerPoint slide designed for global business presentations. Features two color versions—bright blue and warm brown backgrounds—with world maps, bar graphs, and data tables on each slide. Ideal for visualizing market analysis, regional performance, global network status, and cross-country metrics. Provided in 16:9 widescreen PPTX format, fully editable and ready to integrate into your presentation deck.
Usage Points
-
Main Usage
Visualize cross-country metrics such as market size, revenue, market share, and growth rates on a world map to communicate global business landscape at a glance. Highly effective for investor pitches, market analysis reports, and global strategy presentations where regional comparison is critical.
-
How to Use
Place bar graphs on two regions of the world map and input specific numerical data in the table below. Select the color version (blue or brown) that matches your document tone, then customize the title and legend to fit your presentation context.
-
Recommended For
Market analysis sections, global network status updates, regional performance comparisons, and international business strategy discussions. Ideal for presentations to executives, investors, and business partners where data credibility is essential.
-
Slide Structure
Each slide combines a world map background, bar graphs positioned over two regions (visual data layer), and a data table at the bottom (numerical layer). Contains 9 editable areas: 1 title, 2 legend fields, and 6 table cells, supporting comparative information architecture.
Related Products
-

Target Area Network Analysis – Insights into the Global Market
#Company Introduction #Market and Competitor Analysis #Diagram
-

Global Network Introduction and Market Analysis – Business Reaching Out to the World
#Company Introduction #Market and Competitor Analysis #Diagram
-

Pixel Graphical Maps and Tables - Visualizing Global Network
#Company Introduction #Market and Competitor Analysis #Diagram
-

World Map Global Map Travel Guide Statistics by Country - Explore the World
#Company Introduction #Market and Competitor Analysis #Diagram
