Distribution by Animal Region – Market Analysis PowerPoint
RJ0500026_8
- Last Update 06/14/2025
- File Size 0.7MB
- # of Slides 2
- File Format PPTX
- Slide Ratio 16:9
- Color
Keywords
- #Content-Based Slides
- #Design-Based Slides
- #Market and Competitor Analysis
- #Other
- #Target Market
- #Map
- #16:9
- #regional animal distribution map PowerPoint
- #map visualization PowerPoint slide
- #market analysis regional distribution PPT
- #target market map slide
- #how to create a regional comparison PowerPoint
About the Product
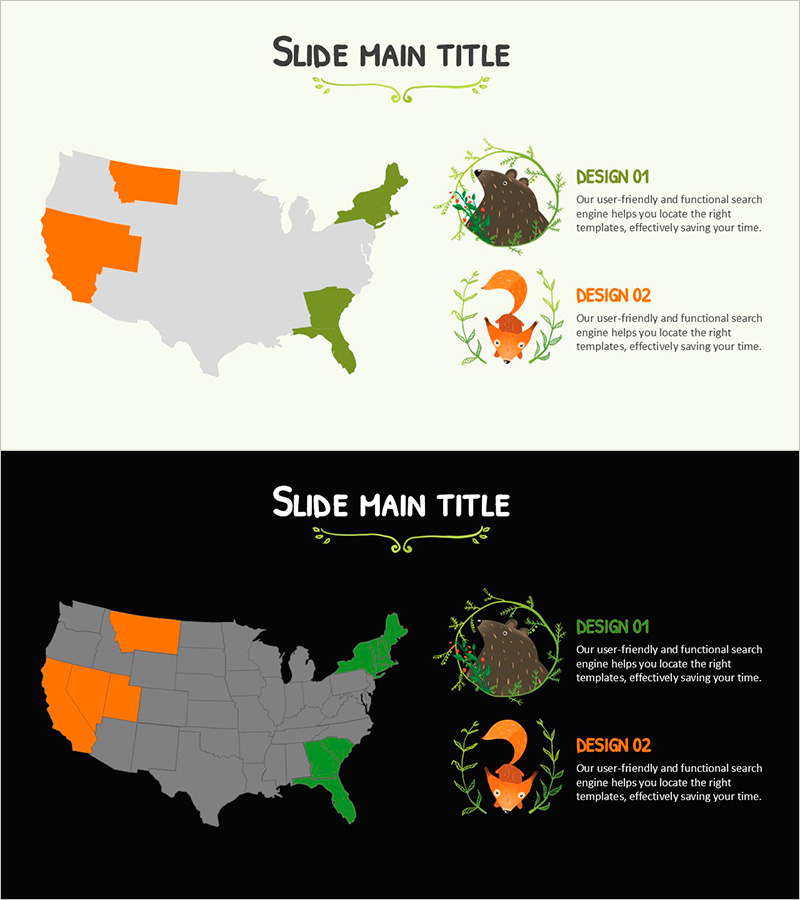
A PowerPoint slide visualizing regional animal distribution across a US map background. The slide uses orange and green color coding to highlight different regions, complemented by animal illustrations and botanical decorative elements, making it ideal for market analysis, target market segmentation, and regional business strategy presentations. The 2-slide set offers both light and dark background design options, with balanced text description areas and map visualization for immediate use in presentations, reports, and business proposals.
Usage Points
-
Main Usage
Visualize regional market conditions, target market distribution, and business expansion plans using map-based graphics to support decision-making. Animal illustrations and botanical accents enhance information readability, while orange and green color differentiation provides intuitive regional characteristic representation.
-
How to Use
Use in the market analysis section when explaining regional customer distribution, competitive landscape, and business expansion plans. Select the light or dark background version matching your presentation environment and existing template tone, then input specific metrics and analysis details in the text areas.
-
Recommended For
Recommended for marketing professionals, business planning teams, investment pitch presenters, and executives developing regional business strategies. Suitable for market research reports, business plans, quarterly performance reports, and new market entry proposals.
-
Slide Structure
2-slide set with each slide divided into map visualization area (left 60%) and text description with animal illustration area (right 40%). The map features 2-3 regions highlighted in orange and green, while the right side displays DESIGN 01 and 02 labels with 2 descriptive text items, creating a comparative analysis structure.
Related Products
-

User Usage Status by Target Country – Market Analysis and Insights
#Market and Competitor Analysis #Diagram #Other
-

Highlighted Circular Global Map – Effective Market Analysis
#Company Introduction #Market and Competitor Analysis #Other
-

Visualizing Global Target Market – Effective Information Delivery
#Company Introduction #Market and Competitor Analysis #Other
-

Target Market Location Icon – Global Market Insights
#Market and Competitor Analysis #Marketing Plan and Strategy #Other
