Market Analysis Visualization with Area Markings and Map Tables
RJ0500025_25
- Last Update 06/13/2025
- File Size 0.9MB
- # of Slides 2
- File Format PPTX
- Slide Ratio 16:9
- Color
Keywords
- #Content-Based Slides
- #Design-Based Slides
- #Market and Competitor Analysis
- #Diagram
- #Other
- #Target Market
- #Table
- #16:9
- #regional map data table PowerPoint slide
- #market analysis presentation design
- #geographic market visualization
- #competitive analysis slide
- #how to create a market map in PowerPoint
About the Product
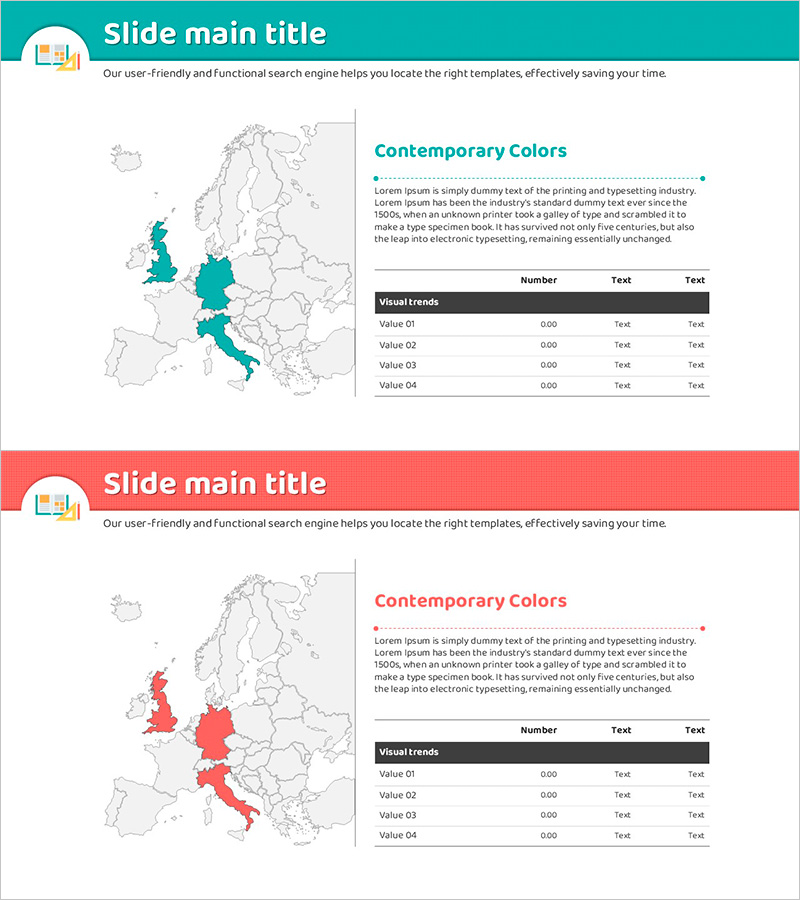
A market analysis PowerPoint slide combining a European regional map with color-coded area markings and data tables. Available in two color versions—turquoise blue and coral red—with a clear left-right layout separating the map area from text and table content. Each slide is designed to visualize regional market conditions, competitive distribution, and market share effectively. The 16:9 widescreen format includes 2 slides ready for immediate use, adding professional credibility to presentations and reports.
Usage Points
-
Main Usage
Simultaneously present regional market conditions, competitor distribution, and market share using both geographic visualization and numerical data. The left-side map highlights regions by color while the right-side table displays specific metrics, creating a clear foundation for strategic decision-making.
-
How to Use
Apply this slide in market analysis sections, business plans, investor pitch decks, and executive reports. Modify map colors to represent regional performance, targets, or risk levels, and replace table data with actual figures to create a credible analytical presentation.
-
Recommended For
Marketing managers, business strategists, financial analysts, and executives presenting regional market analysis. Ideal for global business expansion strategies, regional sales planning, and competitive landscape presentations.
-
Slide Structure
Each slide divides into a 60% left map area (European geography with color-coded regions) and 40% right information area (title, descriptive text, 4-row data table). A colored header banner and icons maintain visual consistency, with clearly defined text and data entry zones for easy customization.
Related Products
-

European Target Market Analysis Table
#Market and Competitor Analysis #Diagram #Other
-

Country-by-Country Revenue Analysis Table – Data-Driven Insights
#Company Introduction #Market and Competitor Analysis #Diagram
-

European Target Market Analysis Table – Foundation for Marketing Strategy
#Market and Competitor Analysis #Marketing Plan and Strategy #Diagram
-

Target Country Analysis Table – The Ideal Tool for Market Analysis
#Market and Competitor Analysis #Diagram #Other
