E-Learning Learning Effect Diagram – Visualizing Business Strategies
RJ0500037_26
- Last Update 06/17/2025
- File Size 1.9MB
- # of Slides 2
- File Format PPTX
- Slide Ratio 16:9
- Color
Keywords
- #Content-Based Slides
- #Design-Based Slides
- #Business Vision and Strategy
- #Business Strategy
- #Diagram
- #Business Strategy
- #Business Direction
- #Cluster
- #Inclusive Cluster Diagram
- #Chain Diagram
- #16:9
- #connected diagram PowerPoint
- #3-step process slide
- #e-learning effectiveness presentation
- #arrow flow diagram
- #business strategy visualization PPT
About the Product
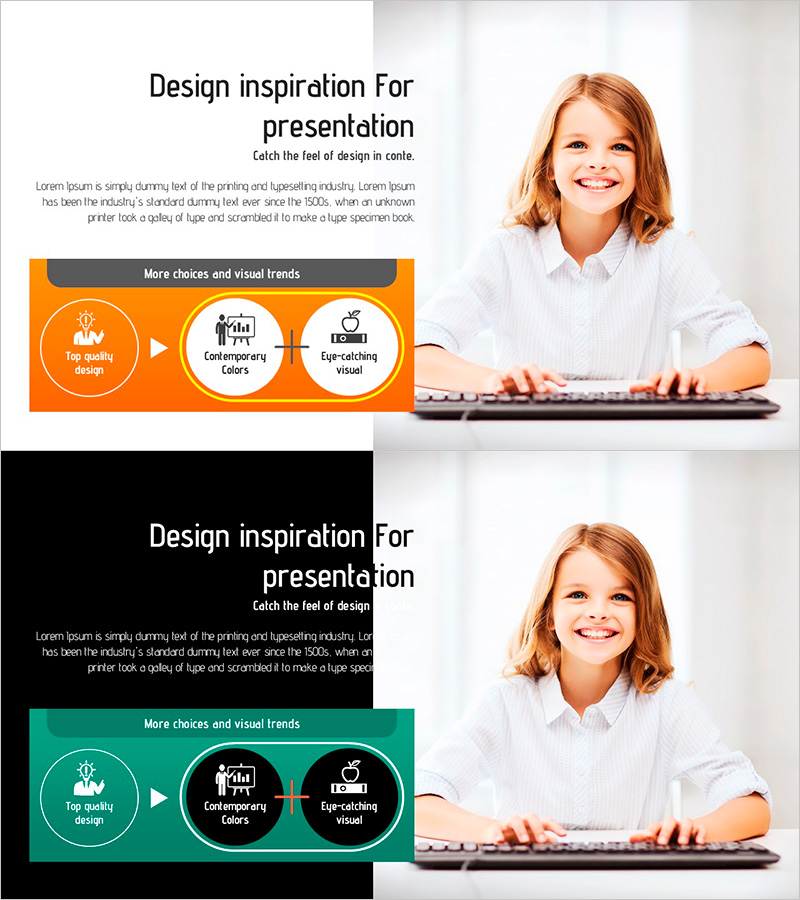
A 3-node connected diagram PowerPoint slide that visualizes e-learning effectiveness and business strategy progression. The linear flow structure connects circular nodes with directional arrows, moving from 'Top Quality Design' on the left through 'Contemporary Colors' in the center to 'Eye-Catching Visual' on the right. Orange and teal two-tone backgrounds with white circular nodes and black text create clear information hierarchy. This 2-slide, 16:9 aspect ratio PPTX template is ready to use for presentations explaining business strategies, learning processes, and step-by-step progress tracking.
Usage Points
-
Main Usage
Visualizes three-stage linear processes such as e-learning progression, business strategy development, and organizational capability building. Each stage's key elements fit into circular nodes connected by arrows, intuitively conveying cause-and-effect relationships and sequence of execution.
-
How to Use
Double-click node text to enter stage titles and descriptions. Fill from left to right: starting stage, middle stage, final stage. Retain the orange-teal color scheme or customize to match your brand colors. Node sizes and arrow styles are fully editable to suit your presentation needs.
-
Recommended For
Training managers explaining learning effectiveness measurement stages, strategy teams sharing business execution processes, and consultants presenting organizational change phases. Suitable for executive briefings, team meetings, and external presentations across various business contexts.
-
Slide Structure
Two-slide set: first slide features orange background with 3 circular nodes (left, center, right) connected by arrows; second slide presents the same 3-node connected diagram on teal background. Each node includes icon and text input areas, optimized for 16:9 widescreen format.
Related Products
-

Blue Green Business Strategy Diagram – Connecting Business Vision and Strategy
#Business Vision and Strategy #Diagram #Business Strategy
-

Pet Market Strategy Diagram – Roadmap for Growth and Success
#Business Vision and Strategy #Business Strategy #Diagram
-

Slide Visualizing Business Vision and Strategy with 3 Included Components
#Product/Service Introduction #Business Vision and Strategy #Diagram
-

Growth Strategy Slide with Subscription Expansion and AI-Driven Roadmap
#Business Vision and Strategy #Marketing Plan and Strategy #Diagram
